Understanding Variation and Errors in Laboratory Testing
Explore the sources of biological and analytical variation in laboratory results, common errors in the request-test-report cycle, and the importance of quality control in ensuring accurate patient care.
In clinical medicine, laboratory results are the backbone of diagnosis, influencing over 70% of medical decisions. However, a pathology result is not an absolute truth; it is a measurement subject to various forms of fluctuation and error. To interpret a patient's blood work accurately, a clinician must distinguish between natural biological changes and errors introduced during the testing process.
The Request-Test-Report Cycle
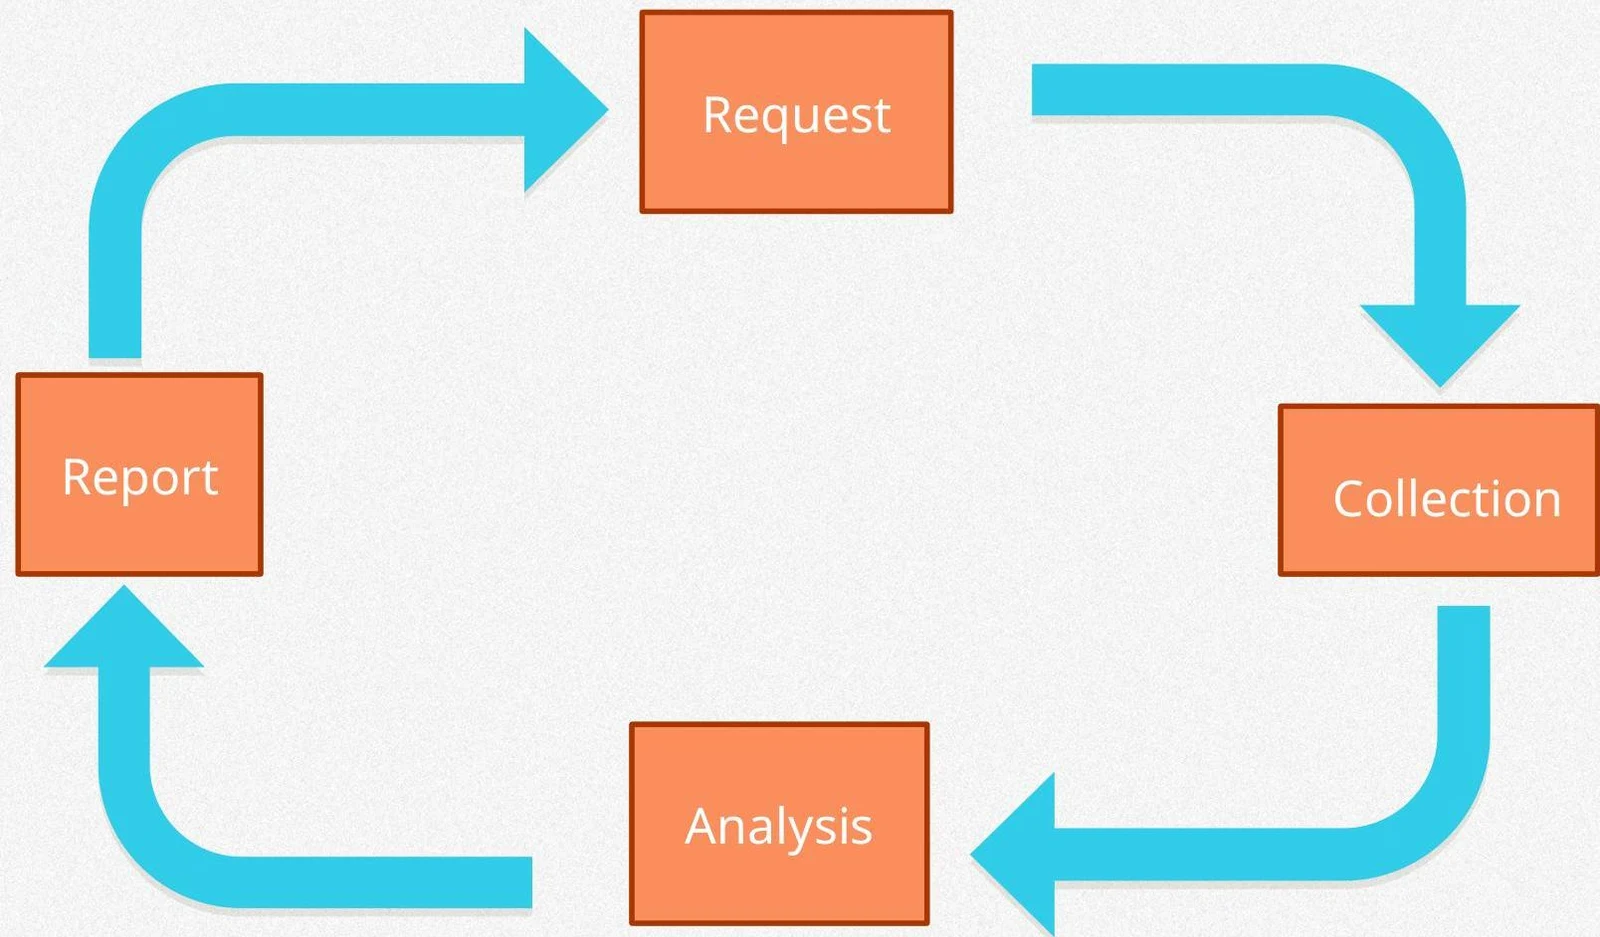
The journey of a pathology result follows a specific flow known as the Request-Test-Report cycle. This cycle begins when a doctor prepares a pathology request form, followed by the collection of a specimen (such as blood, urine, or tissue) from the patient, the actual laboratory analysis, and finally, the reporting of the results back to the clinician.
A flowchart illustrating a process with steps: Request, Collection, Analysis, and Report, shown in a cyclical manner.
Understanding where errors occur within this cycle is vital for ensuring patient safety. Errors are categorized into three distinct stages:
Pre-analytical Error: Occurs before the sample is analyzed. This is the most common stage for errors and includes issues like incorrect patient identification, wrong collection containers, improper transport temperatures, or failure to follow fasting instructions.
Analytical Error: Occurs during the actual testing phase. This involves issues with the equipment, reagents, or the technician's handling of the sample.
Post-analytical Error: Occurs after the test is completed, such as errors in data transcription, incorrect unit reporting, or failures in the digital transfer of results.
Biological Variation
Even with a perfect testing process, a patient's analyte levels will naturally fluctuate. This is known as biological variation.
Intraindividual Variation
This refers to fluctuations within a single person over time. These changes can be:
Life-stage related: Changes due to age, growth, puberty, or menopause.
Cyclical/Diurnal: Fluctuations based on the time of day, sleep patterns, or meals.
Seasonal: Changes occurring due to seasonal environmental shifts.
Interindividual Variation
This refers to the differences in "setting points" between different people. For example, two healthy adults will have different baseline levels of certain hormones or minerals.
Some analytes are tightly regulated by the body to maintain homeostasis, such as Sodium and Potassium, resulting in low biological variation. Others, like Albumin or Iron, exhibit much higher natural fluctuations.
Analytical Variation: Accuracy and Precision
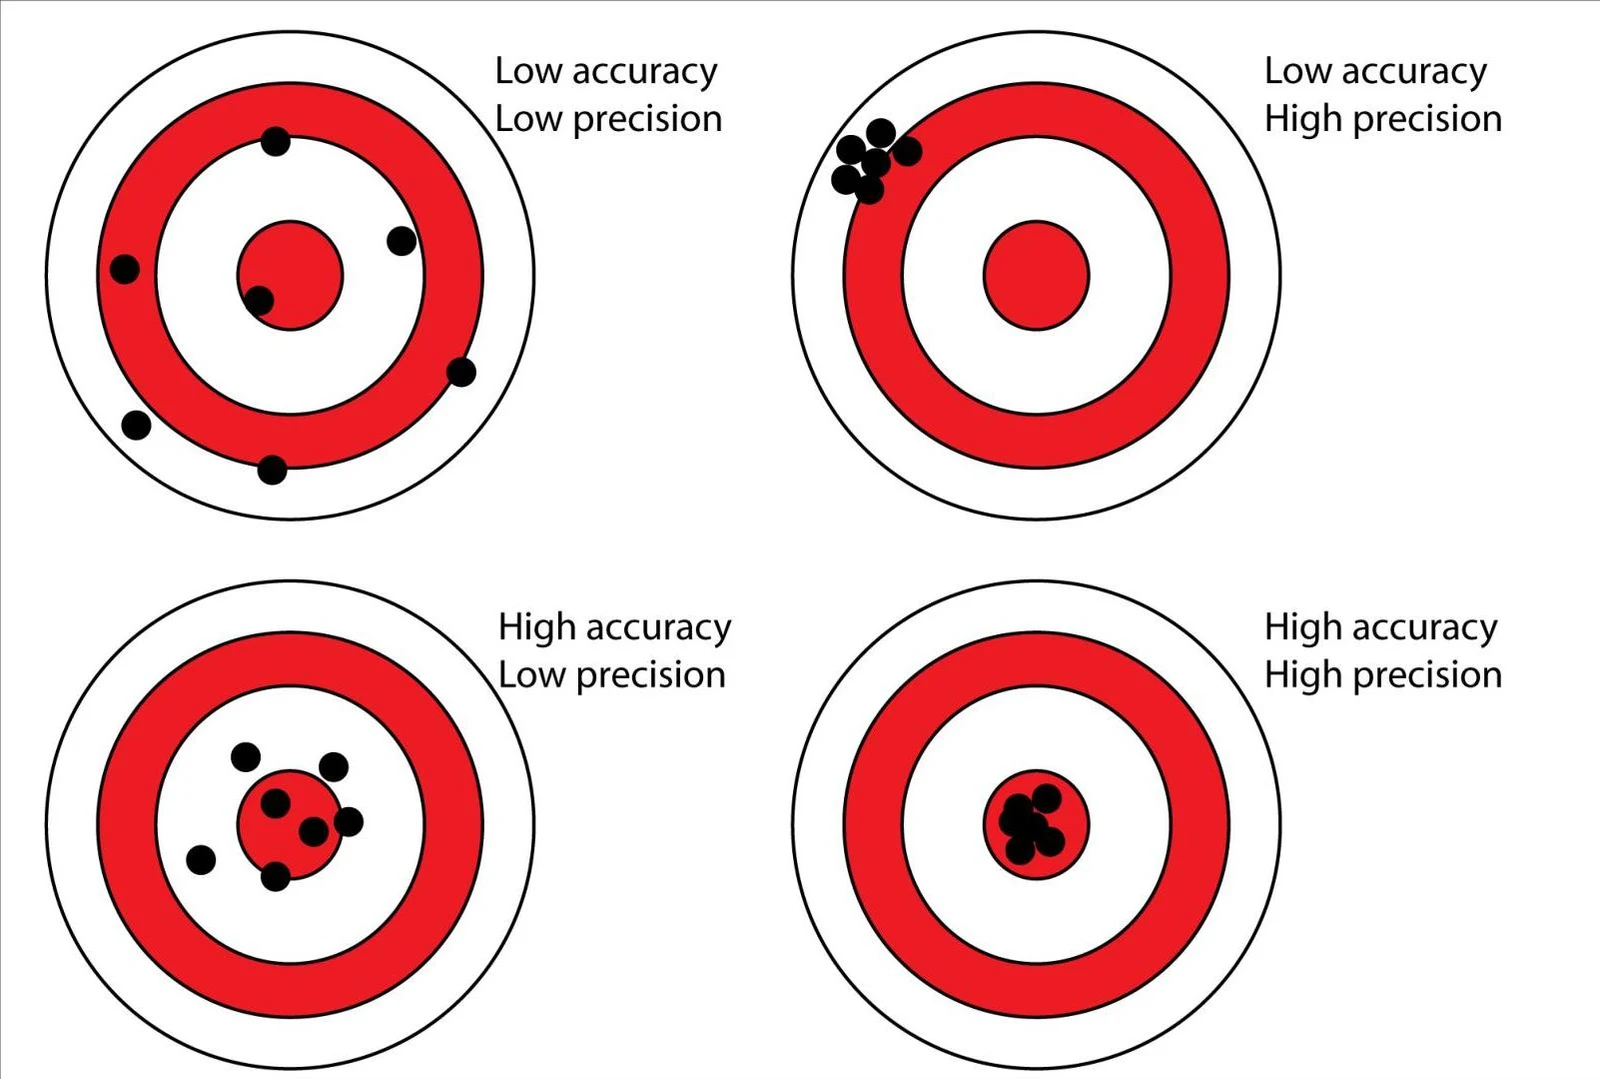
Analytical variation refers to the imprecision inherent in the laboratory testing process itself. To evaluate how well an assay performs, we look at two key concepts:
Diagrams illustrating accuracy and precision using target analogies. The top left shows low accuracy and low precision. The top right shows low accuracy and high precision. The bottom left shows high accuracy and low precision. The bottom right shows high accuracy and high precision.
Accuracy: How close a measurement is to the true value.
Precision (Repeatability): How reproducible the measurements are when the test is repeated under the same conditions.
Measuring Variation with CV
The precision of an assay is quantified using the Coefficient of Variation (CVA). This expresses the standard deviation as a percentage of the mean, which normalizes the units across different types of tests.
CVA=(MeanStandard Deviation)×100%
A low CVA indicates high precision, while a high CVA indicates significant imprecision.
Exam Tip: The Relative Total CV
To determine if a laboratory test is clinically useful for monitoring a patient, we calculate the ratio of analytical variation to biological variation:
Relative Total CV=CVBCVA
If the analytical imprecision (CVA) is too high relative to the biological variation (CVB), the test will be unable to detect meaningful biological changes in the patient.
Reference Ranges
A reference range (or interval) defines the values found in a healthy population.
Statistical Determination
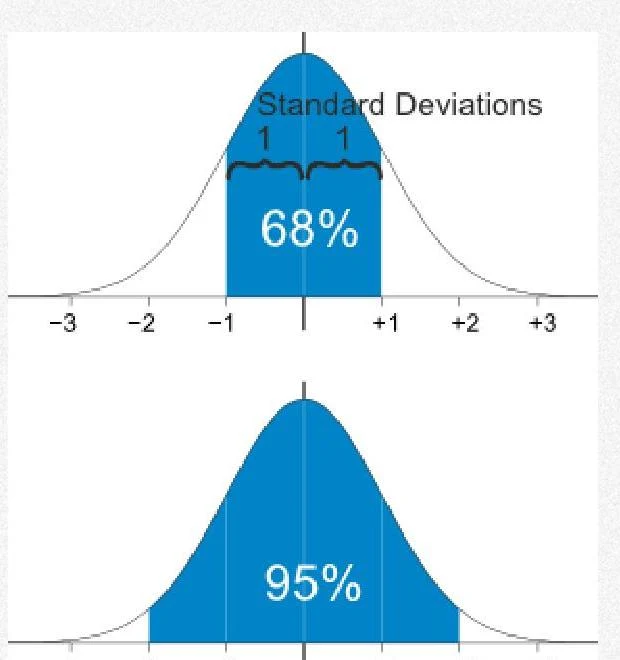
Reference ranges are typically determined by testing a large group of "normal" individuals and calculating the mean and the standard deviation (SD). Statistically, the range is set at ±2 SD from the mean.
The image displays two normal distribution curves, illustrating the empirical rule. The top curve shows that approximately 68% of the data falls within one standard deviation of the mean. The bottom curve indicates that approximately 95% of the data falls within two standard deviations of the mean.
Because this range covers 95% of a healthy population, it is statistically expected that 5% of healthy individuals (1 in 20) will naturally fall outside the range.
Factors Influencing Ranges
Reference ranges are not universal; they must be tailored to specific populations:
Age: For example, Alkaline Phosphatase (ALP) levels are much higher in children due to active bone growth.
Sex:Creatine Kinase (CK) levels are generally higher in men due to higher muscle mass.
Physiological State: Fasting vs. fed status, pregnancy, or time of day (diurnal variation) can all shift the expected range.
Laboratory Equipment: Because analytical variation depends on specific technology, most laboratories set their own internal reference ranges based on their specific equipment and reagents.
Quality Control and Error Mitigation
To minimize analytical error, laboratories use Calibrators (materials with known values used to adjust the machine) and Controls (samples used to monitor ongoing performance).
Westgard Rules
Laboratories use a set of statistical rules known as Westgard Rules to decide if an analytical run is "in control" or "out of control". These rules look for patterns in the control data that suggest systematic or random error.
This is a control chart illustrating a 13s rule violation, where a single measurement falls outside the 3s control limit. The chart also defines the 22s rule, which indicates two consecutive measurements exceeding the same 2s control limit.
Common rules include:
13s: A single measurement is more than 3 SD from the mean (indicates a major error; reject the run).
22s: Two consecutive measurements exceed the same 2 SD limit (indicates systematic error; reject the run).
12s: A single measurement exceeds 2 SD; this is often treated as a warning to inspect the data rather than an immediate rejection.
By employing Quality Control (QC), Quality Assurance (QA), and rigorous Quality Systems (QS), laboratories work to ensure that the "reality" of pathology testing—where variation is inevitable—is managed to provide the safest possible results for patient care.
Keep reading for free.
Create an account to finish this reading and make it part of your study routine.