Understanding Brain Connectivity with fMRI and Network Topology
Explore how fMRI and network topology analyze brain connectivity, focusing on the BOLD signal, functional and structural connections, and their application in understanding conditions like epilepsy.
In clinical neurology, diagnosing epilepsy often relies on identifying abnormal electrical discharges via EEG or structural lesions via MRI. However, many patients suffer from cognitive deterioration and recurrent seizures even when conventional activation maps—which show which brain regions "light up" during a task—appear entirely normal. To understand why these patients experience functional decline, researchers have turned to connectivity analysis. By shifting the focus from individual brain regions to the complex networks that connect them, we can uncover the hidden topological disruptions that characterize the chronic epileptic brain.
The Foundation: fMRI and the BOLD Signal
Functional Magnetic Resonance Imaging (fMRI) is a cornerstone of modern neuroimaging, providing a "window" into brain function. Unlike structural MRI, which shows anatomy, fMRI measures the dynamic activity of the brain. This is achieved by monitoring the BOLD (Blood Oxygen Level Dependent) signal.
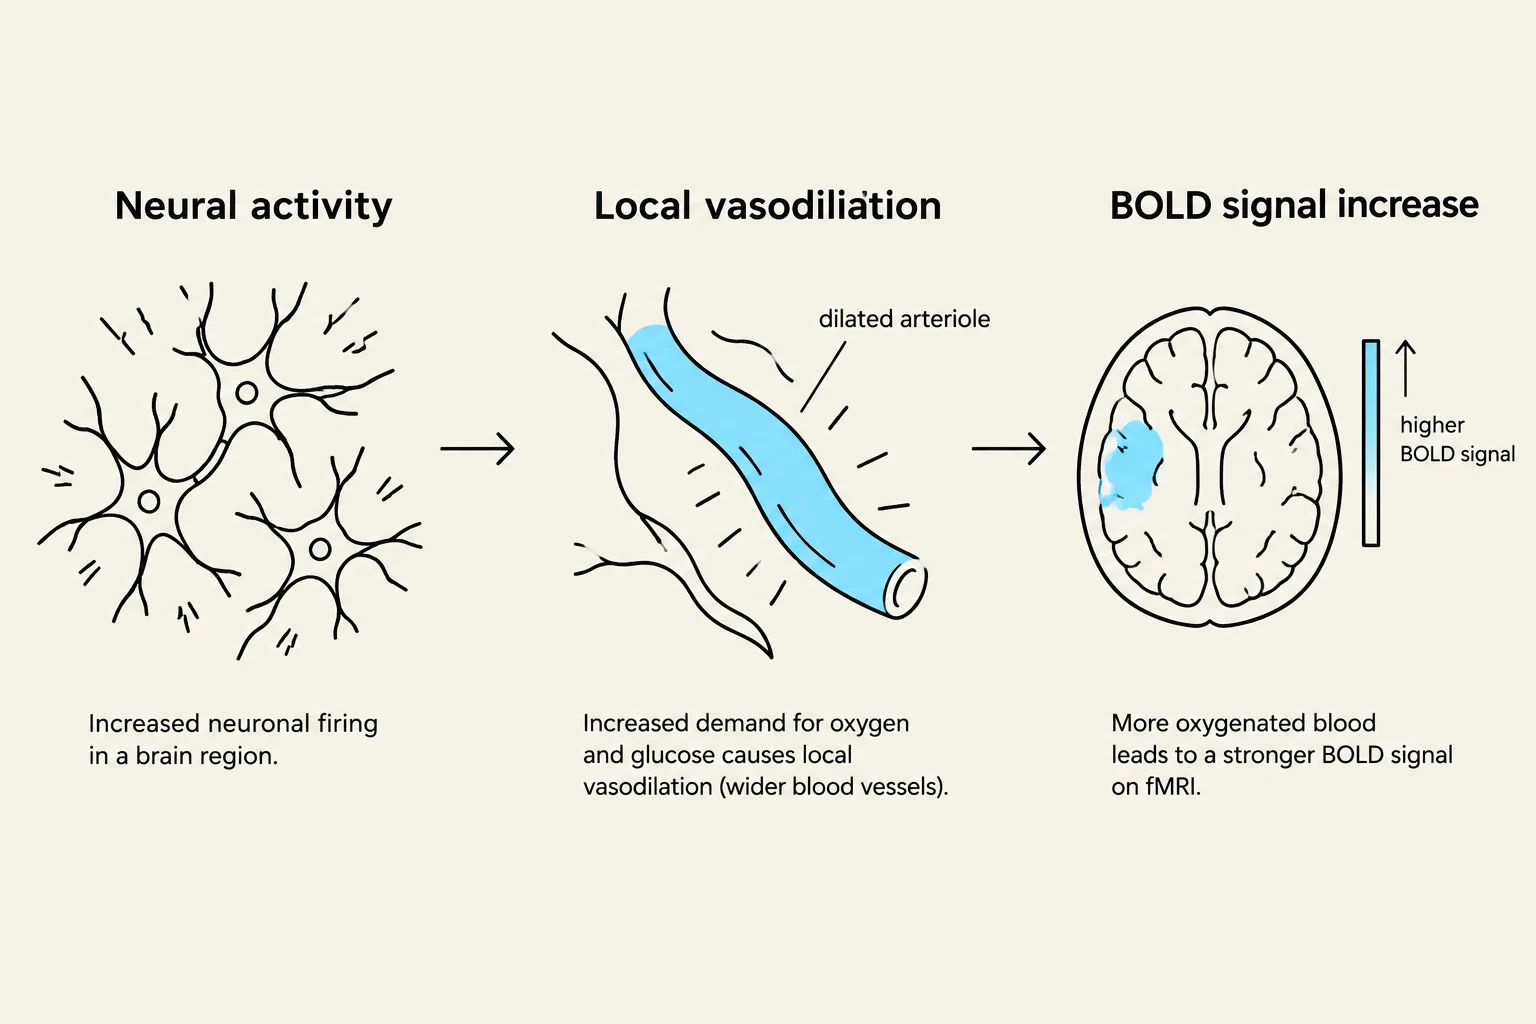
The BOLD signal relies on the relationship between neural activity and hemodynamics. When neurons become active, they demand more oxygen. The body responds via local vasodilation, increasing blood flow to the area. This creates an "overshoot" where the supply of oxygenated hemoglobin (O2-Hb) exceeds the local metabolic demand. Because oxygenated and deoxygenated hemoglobin have different magnetic properties, the MRI scanner can detect these local changes in the magnetic field.
By recording these changes over time, we generate a BOLD time-series—a continuous stream of data representing the fluctuating activity of a specific brain region.
This diagram illustrates the process by which neural activity leads to a BOLD signal increase on fMRI. Increased neuronal firing in a brain region increases the demand for oxygen and glucose, causing local vasodilation (wider blood vessels). This results in more oxygenated blood flow, which leads to a stronger BOLD signal detected by fMRI.
Exam Tip: Remember that fMRI does not measure electricity directly. It measures a hemodynamic proxy (blood oxygenation) of neural activity. The signal changes are relatively small, typically around 1-2% at 1.5 Tesla and 2-4% at 3.0 Tesla.
From Signals to Networks: Connectivity Analysis
To move from raw signals to a map of brain organization, we use connectivity analysis. This process begins with cortex parcellation, where the brain is divided into distinct anatomical regions using an atlas, such as the AAL atlas, which defines n=90 specific regions.
Once the brain is parcellated, we analyze the BOLD time-series of every region. We look for functional connections, which are defined by the correlation between the time-series of any two regions. If two regions show highly synchronized fluctuations in their BOLD signals, they are considered functionally connected. These relationships are organized into a connectivity matrix—a mathematical grid where each cell represents the strength of the connection between a pair of brain regions.
While functional connectivity tells us how regions "talk" to each other, we also need to understand the physical "wiring" that makes this possible. This is where Diffusion Tensor Imaging (DTI) and tractography come in. DTI measures the microstructure of white matter by tracking the Brownian motion of water molecules. Through whole-brain tractography, we can reconstruct the physical pathways (axons) that connect distant parts of the cortex, creating a structural connectome.
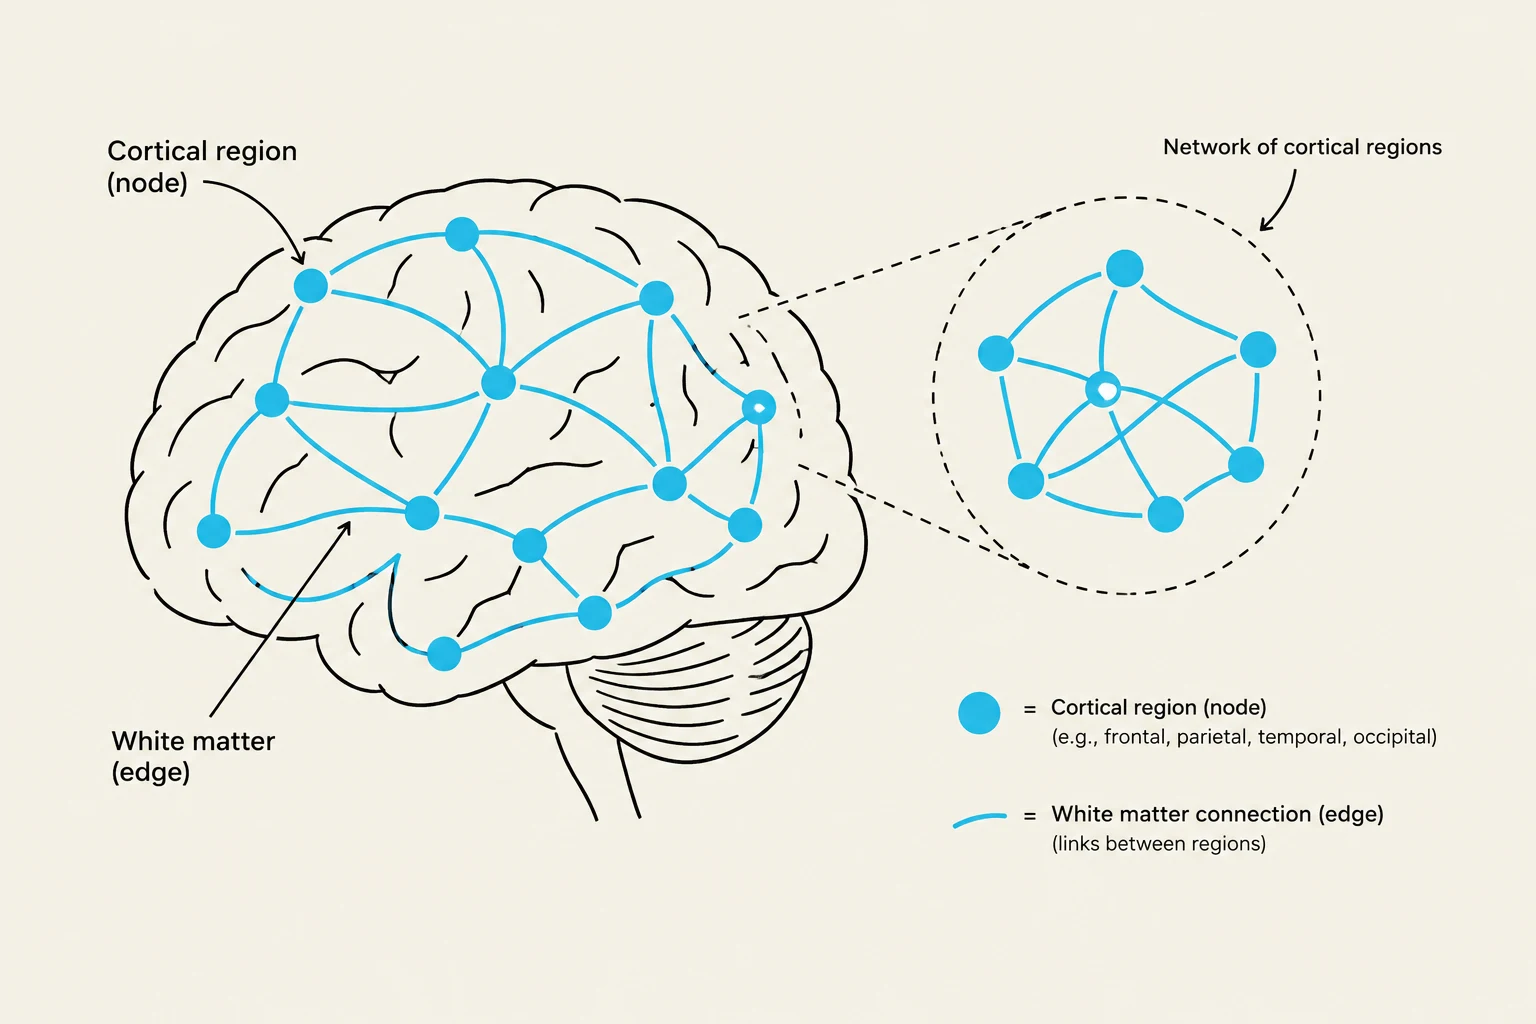
This diagram illustrates the brain's network of cortical regions, represented as nodes, connected by white matter pathways, depicted as edges. A magnified view shows a cluster of interconnected cortical regions.
Network Topology and Parameters
To describe the complex architecture of these connections, researchers use network topology. Instead of looking at single connections, topology treats the brain as a mathematical graph consisting of nodes (the parcellated brain regions) and edges (the functional or structural connections).
By applying graph theory, we can calculate specific network parameters that describe the efficiency and organization of the brain:
Connectivity Strength: The overall density or total number of connections within the network.
Mean Path Length: The average number of steps (edges) required to travel from one node to any other node in the network. A shorter path length generally implies more efficient communication.
Network Efficiency: A measure of how effectively information is exchanged across the network, closely related to the path length.
Clinical Application: Cryptogenic Epilepsy
The power of network topology is most evident in the study of cryptogenic epilepsy—cases where the underlying cause of seizures is not immediately apparent.
In many chronic epilepsy patients, standard fMRI activation maps show no significant differences compared to healthy controls. However, when researchers apply connectivity analysis and examine the whole-brain tractography connectome, the "hidden" pathology emerges.
Research has demonstrated that the epileptic brain undergoes specific topological alterations:
Increased Mean Path Length: Specifically within local networks, suggesting that information must take more "steps" to travel, which disrupts efficient processing.
Lower Number of Connections: A reduction in overall connectivity strength.
These changes indicate a fundamental disruption in the brain's ability to integrate information across distant regions and segregate specialized functions. This breakdown in network integrity is often linked to the cognitive deterioration observed in patients with chronic epilepsy.
Summary Table: Connectivity Findings in Chronic Epilepsy
Parameter
Change in Epilepsy
Functional Implication
Activation Maps
No significant change
Standard tasks may appear normal
Connectivity Strength
Decreased
Fewer pathways for information exchange
Mean Path Length
Increased
Less efficient communication between regions
Network Integrity
Reduced
Linked to cognitive impairment
Keep reading for free.
Create an account to finish this reading and make it part of your study routine.