Usability Evaluation and Experimental Methods in Human-Computer Interaction
This article explores diverse methodologies for evaluating human-computer interaction, including survey instruments, acceptance tests, active use evaluation, and controlled experiments. It covers methods for gathering subjective and objective user feedback to improve system design.
In the field of Human-Computer Interaction (HCI), designers often face the "curse of knowledge"—becoming so enamored with their own creations that they fail to see the flaws from a user's perspective. To combat this, extensive testing is a necessity. Evaluation is not a one-size-fits-all process; the strategy depends on the stage of design, the novelty of the project, the criticality of the system (such as a life-critical medical interface versus a museum exhibit), and the available budget and time.
Effective evaluation ranges from quick expert reviews to ambitious, multi-year studies for complex systems like air-traffic control. This article explores the diverse methodologies used to assess how humans interact with technology, moving from subjective surveys to rigorous scientific experiments.
Survey Instruments
One of the most common and cost-effective ways to gather feedback is through written user surveys. Surveys are excellent companions to usability tests because they allow researchers to capture the subjective impressions of users regarding specific interface aspects, such as the design of displays or the syntax of inputs.
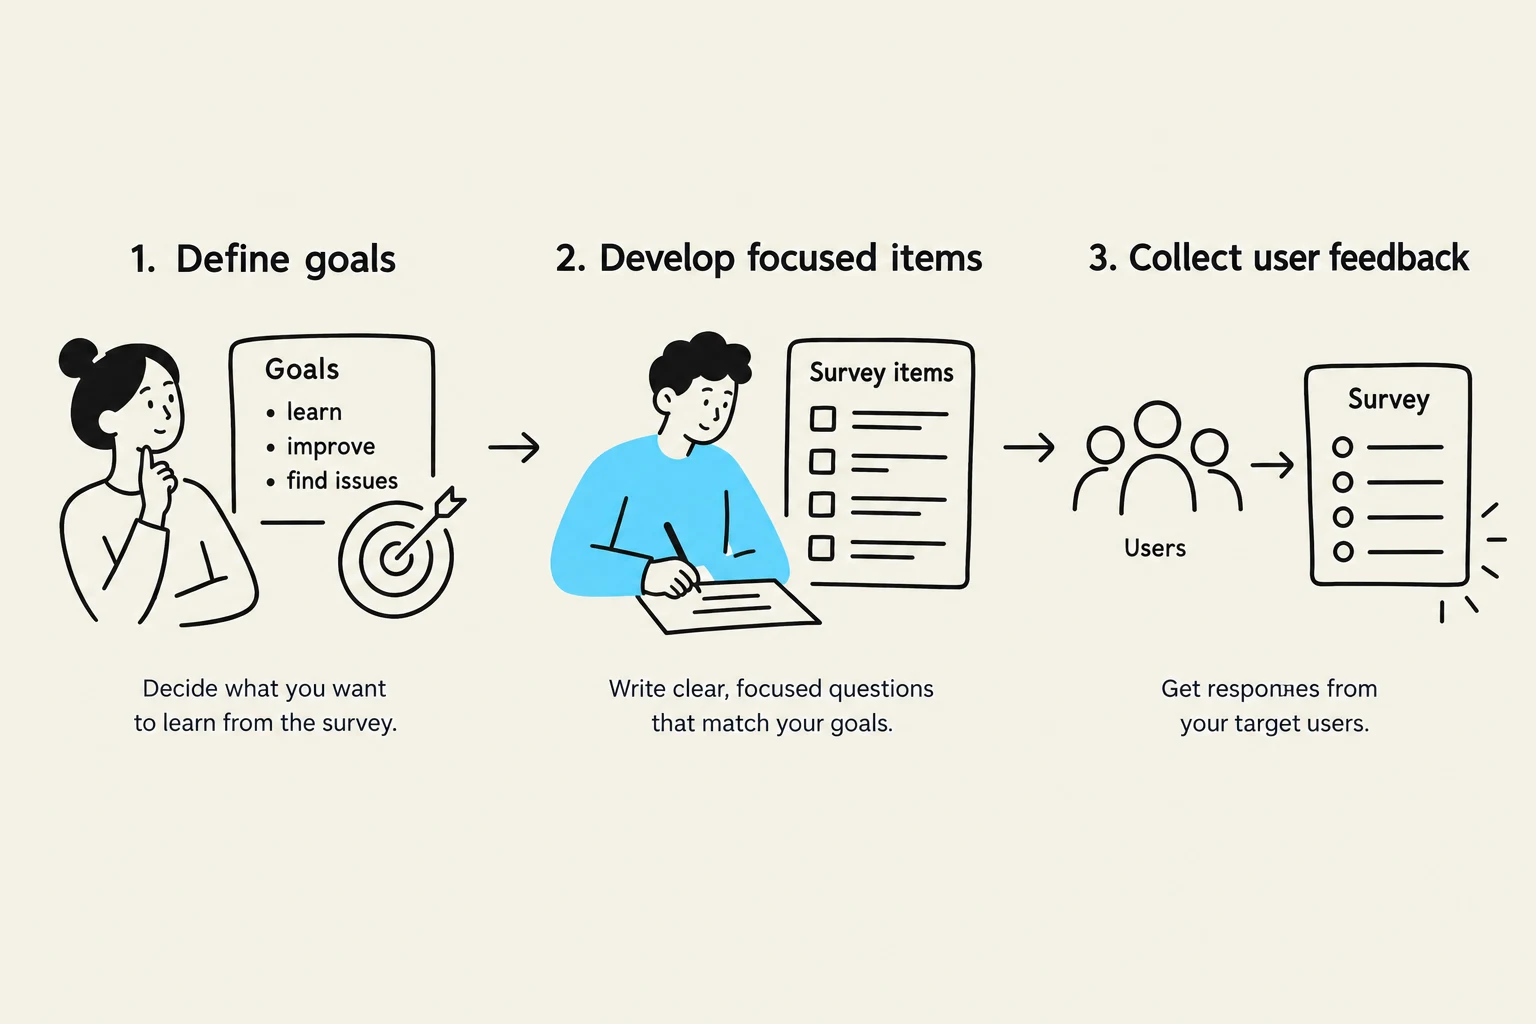
When designing a survey, it is vital to have clear goals. Researchers often use surveys to ascertain:
User Background: Age, gender, education, and income.
Experience: Depth of knowledge and familiarity with specific software.
Personality Style: Whether a user is an early adopter or risk-averse.
Emotional State: Whether the user felt frustrated, confused, or in control after using the interface.
A well-known example of a standardized tool is the Questionnaire for User Interaction Satisfaction (QUIS). While online surveys are efficient and reduce printing costs, researchers must remain aware of potential sample biases.
Exam Tip: If asked about the difference between objective and subjective data, remember that surveys primarily capture subjective impressions (how the user feels), whereas performance logs capture objective data (what the user actually did).
This illustration outlines the three key steps in conducting a survey: defining goals, developing focused questions, and collecting user feedback.
Acceptance Tests and Measurable Criteria
For large-scale implementation projects, managers often require more than just "good feedback"; they require proof of performance through acceptance tests. In these scenarios, a product must meet specific, objective goals to be accepted by the customer.
A common mistake in design is using the vague term "user-friendly" as a metric. To be scientifically valid, usability must be broken down into measurable criteria. These include:
Time to learn: How long it takes a user to master specific functions.
Speed of performance: How quickly a task is completed.
Error rates: The frequency of mistakes made by users.
Retention: How well users remember commands over time.
Subjective satisfaction: Quantifiable ratings of user happiness.
If a system fails to meet these predefined criteria, it must be reworked until success is demonstrated.
Evaluation During Active Use
Evaluation does not end once a product is released. Successful "active use" requires continuous monitoring to achieve incremental improvements. There are two primary ways to evaluate a system while it is in the hands of real users:
Qualitative Methods: Interviews and Focus Groups
Interviews with individual users allow researchers to pursue specific concerns in depth. Conversely, focus group discussions are valuable for determining if a specific comment or complaint is a universal issue shared by many users.
Quantitative Methods: Data Logging
Modern software architecture allows for continuous user-performance data logging. System managers can automatically collect data on:
Patterns of system usage.
Speed of user performance.
Frequency of requests for online assistance.
Tools like TechSmith’s Morae can automate this, providing visual outputs such as the number of mouse clicks per task over time.
This diagram illustrates a feedback loop in a system, showing user interaction, system processing, automated data analysis, and feedback for design improvements.
Controlled Psychologically-Oriented Experiments
To reach the highest level of scientific rigor, researchers employ controlled psychologically-oriented experiments. These experiments follow the formal scientific method to isolate the effects of specific design changes on human performance.
The process typically follows these steps:
Hypothesis Formulation: State a lucid, testable hypothesis.
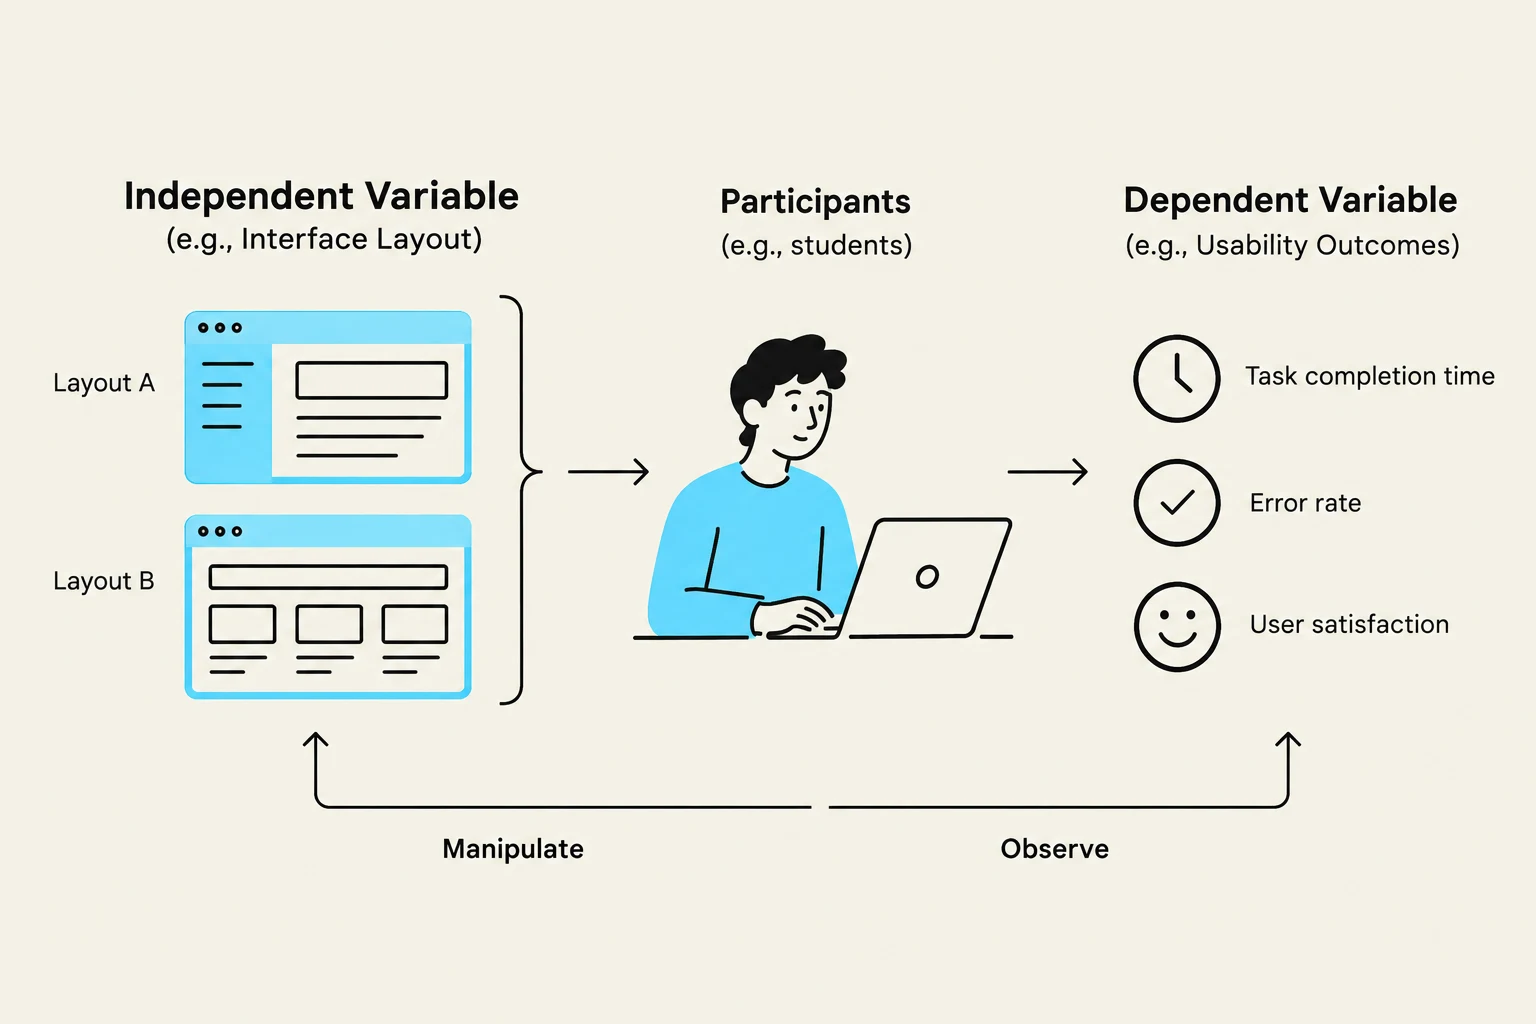
Variable Manipulation: Identify independent variables (the factors you change, such as button color or menu layout) and dependent variables (the factors you measure, such as error rate or time taken).
Subject Selection: Judiciously select subjects and use random assignment to groups to minimize bias.
Control: Minimize biasing factors, such as inconsistent testing procedures or non-representative samples.
Analysis: Apply statistical methods to the collected data to determine if the results are significant.
By comparing a test group against a control group, researchers can fine-tune interfaces with mathematical precision.
This diagram illustrates a basic experimental design, showing the manipulation of an independent variable (interface layout) and the observation of dependent variables (task completion time, error rate, user satisfaction) by participants.
Summary Table: Experimental Variables
Variable Type
Definition
Example in HCI
Independent
The factor being manipulated
A new navigation menu style
Dependent
The factor being measured
The time taken to find a file
Control
Factors kept constant
The same computer hardware and lighting
Through these diverse methods—from the subjective warmth of an interview to the cold precision of a controlled experiment—designers can ensure that the systems they build truly serve the humans who use them.
Keep reading for free.
Create an account to finish this reading and make it part of your study routine.