Understanding the Standard Form of a Linear Equation
Learn about the standard form of a linear equation (Ax + By = C), how to find intercepts, and how to graph lines using intercepts or a table of values. Covers slope-intercept form and special cases like horizontal and vertical lines.
In algebra, a linear equation is a mathematical way to describe a straight line on a coordinate plane. While you may be familiar with equations that look like $y = mx + b$, there is another powerful way to write these relationships known as the Standard Form. This article will guide you through how to identify different forms of linear equations, how to find key features like intercepts and slope, and how to graph them effectively.
The Standard Form of a Linear Equation
The Standard Form of a linear equation is written as:
$Ax + By = C$
In this format, A, B, and C are usually integers. Unlike the slope-intercept form, which focuses on how y changes relative to x, the standard form is excellent for representing real-world scenarios where two different quantities add up to a fixed total.
For example, imagine you are buying shirts for a math club. If short-sleeved shirts cost $10 (x) and long-sleeved shirts cost $12 (y), and you have a total budget of $300, your equation would be:
10x+12y=300
In this case, the equation represents all the possible combinations of x and y that satisfy your budget.
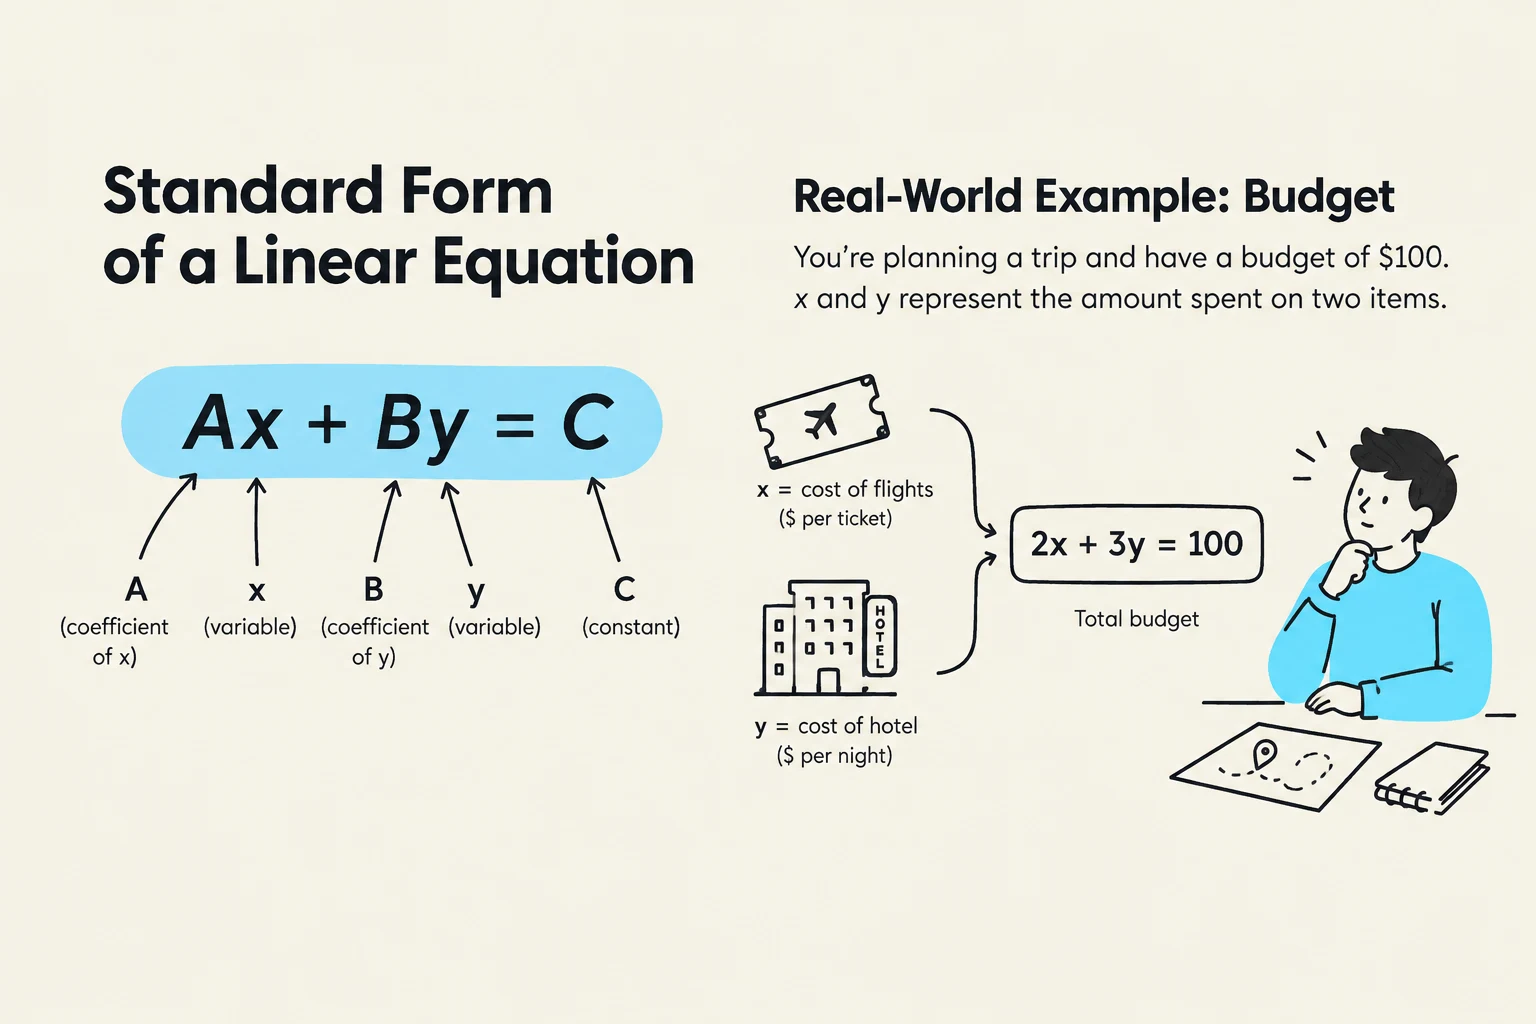
This illustration explains the standard form of a linear equation (Ax + By = C) and provides a real-world example of a budget where x represents the cost of flights and y represents the cost of a hotel, with a total budget of $100.
Finding Intercepts: The Shortcut to Graphing
One of the most efficient ways to graph an equation in standard form is by finding the intercepts. An intercept is a point where the line crosses one of the axes.
The x-intercept
The x-intercept is the point where the line crosses the horizontal x-axis. At this point, the value of y is always 0. To find it, simply plug 0 in for y and solve for x. The result is written as an ordered pair: (x,0).
The y-intercept
The y-intercept is the point where the line crosses the vertical y-axis. At this point, the value of x is always 0. To find it, plug 0 in for x and solve for y. The result is written as an ordered pair: (0,y).
Exam Tip: When finding intercepts, always remember to write your final answer as an ordered pair. For example, if x=4 when y=0, your x-intercept is (4,0).
Worked Example: Finding Intercepts
Let's look at the equation 2x+3y=12:
Find the x-intercept:
Set y=0:
2x+3(0)=122x=12x=6
The x-intercept is (6,0).
Find the y-intercept:
Set x=0:
2(0)+3y=123y=12y=4
The y-intercept is (0,4).
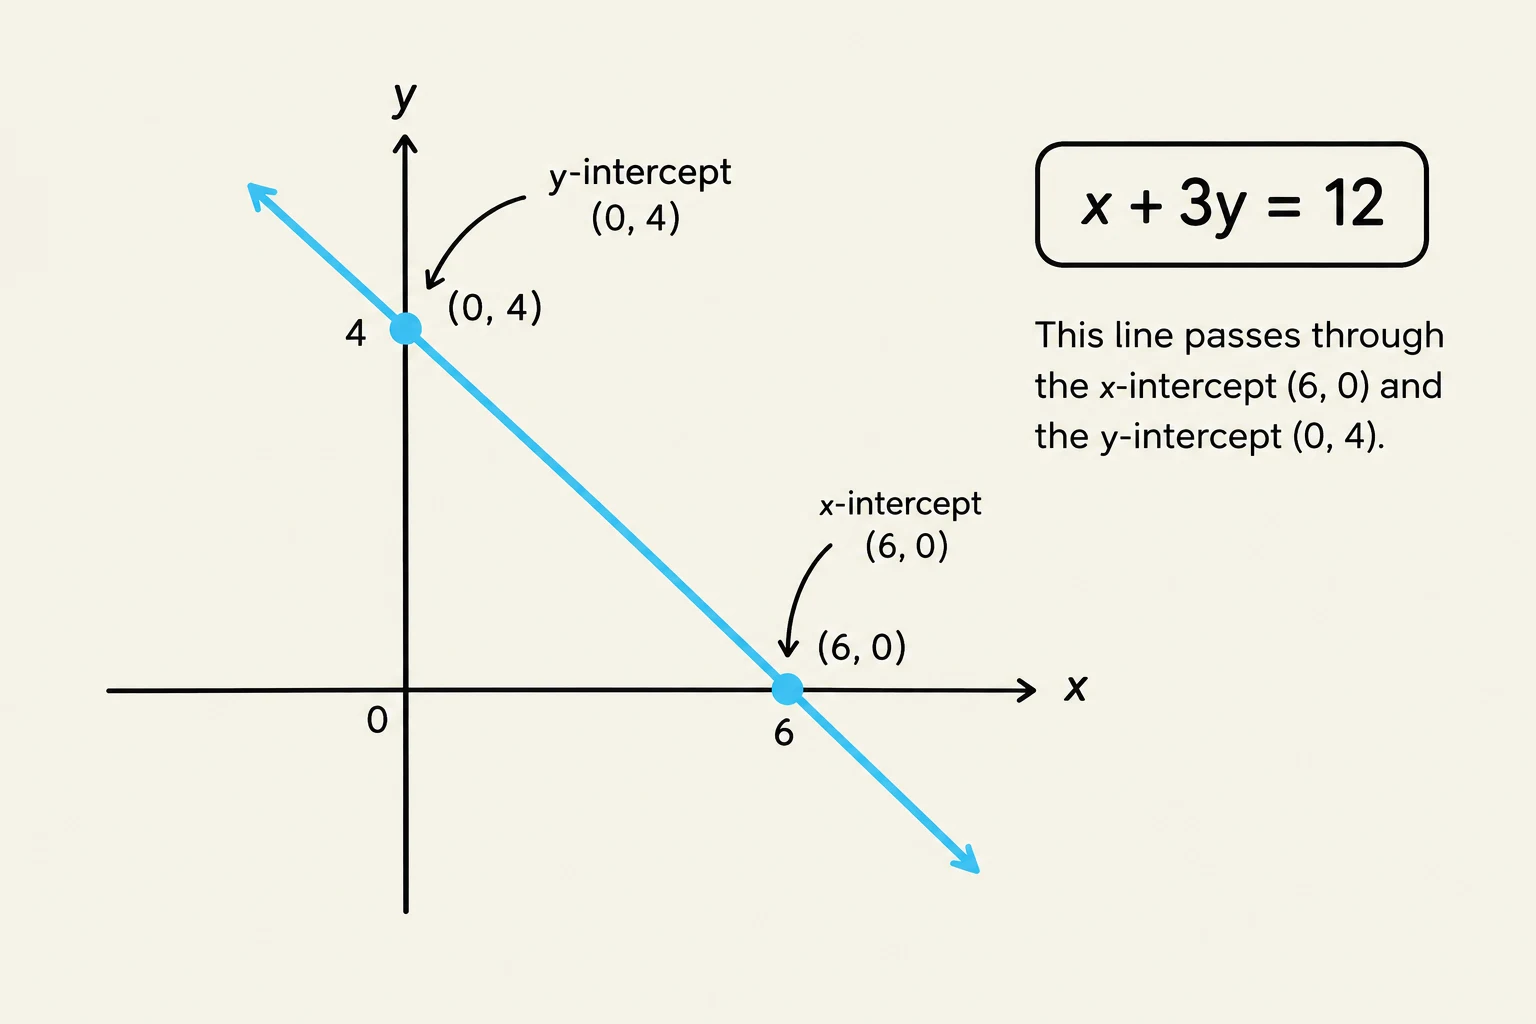
A graph illustrating the line represented by the equation x + 3y = 12, showing its x-intercept at (6, 0) and y-intercept at (0, 4).
Graphing Using a Table of Values
If you aren't using intercepts, you can graph any line by creating a table of values. This involves choosing "convenient inputs" for x (numbers that are easy to work with), calculating the resulting y values, and plotting those points on a graph.
For an equation like y=−x+1, you might choose x values of $-1, 0,$ and 1:
If x=−1, then y=−(−1)+1=2→ Point: (−1,2)
If x=0, then y=−(0)+1=1→ Point: (0,1)
If x=1, then y=−(1)+1=0→ Point: (1,0)
Once you plot these points, you can use a straight-edge to draw the line.
Slope and Slope-Intercept Form
While standard form is great for totals, the Slope-Intercept Form is the most common way to describe the steepness and position of a line. It is written as:
$y = mx + b$
In this equation:
m represents the slope (the steepness of the line).
b represents the y-intercept (where the line crosses the y-axis).
You can convert an equation from standard form to slope-intercept form by solving for y. For example, if we take x+y=9, we can subtract x from both sides to get y=−x+9. Here, the slope m is −1 and the y-intercept b is 9.
Special Cases: Horizontal and Vertical Lines
Not all lines move diagonally. Some lines are perfectly flat or perfectly upright.
Horizontal Lines
A horizontal line stays at the same height regardless of the x value. Its equation is always written as:
y=c
(where c is a constant). For example, y=4 or y=−3 are horizontal lines. Because they have no "rise," the slope of a horizontal line is 0.
Vertical Lines
A vertical line stays at the same position on the x-axis regardless of the y value. Its equation is written as:
x=c
(where c is a constant). For example, x=4 or x=−1 are vertical lines.
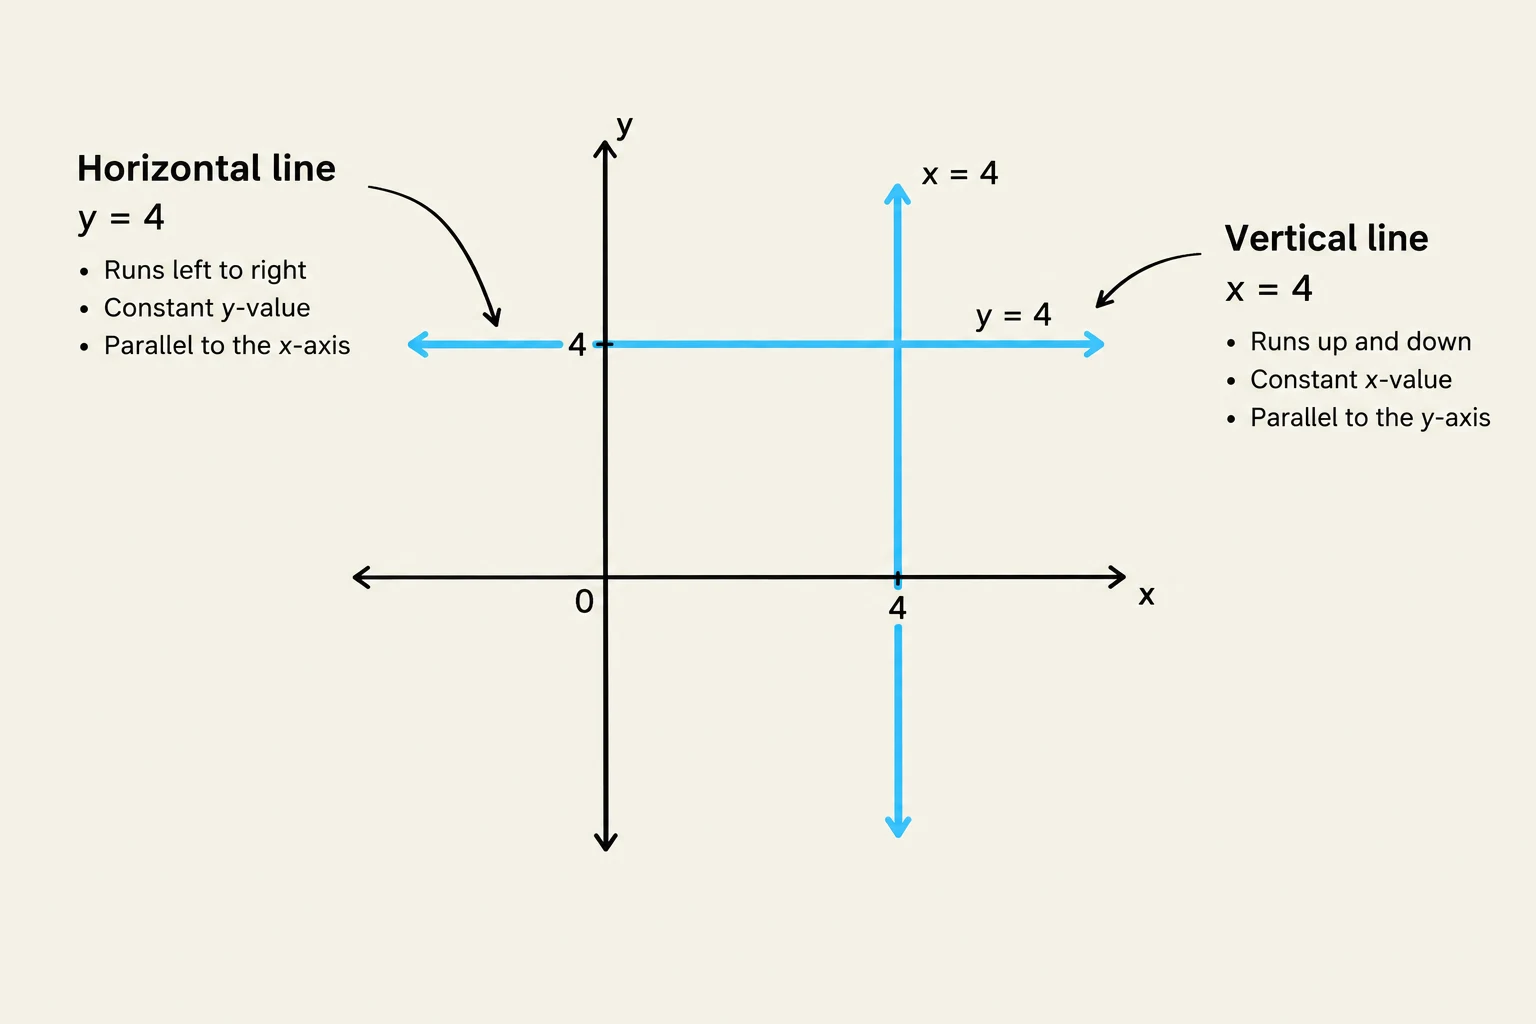
This graph illustrates a horizontal line defined by y = 4 and a vertical line defined by x = 4 on a Cartesian coordinate system. The horizontal line is parallel to the x-axis and has a constant y-value, running left to right. The vertical line is parallel to the y-axis and has a constant x-value, running up and down.
Note: Vertical lines are unique because they do not have a y-intercept (unless they are the y-axis itself) and their slope is considered "undefined" because you cannot divide by zero.
Keep reading for free.
Create an account to finish this reading and make it part of your study routine.