Understanding the Spearman Rank Correlation Coefficient in Biostatistics
This article explains the Spearman rank correlation coefficient, a statistical measure used to determine the strength and direction of a relationship between two variables, particularly when data is ordinal or normality assumptions are not met. It details the fundamentals of correlation, key assumptions for Spearman's
In biostatistics, researchers often seek to understand how two different variables relate to one another. Does an increase in one lead to an increase or decrease in another? To answer this, we use a statistical measure known as a correlation coefficient. This coefficient is a numerical value that describes both the strength and the direction of a relationship between two variables.
The Fundamentals of Correlation
Before diving into specific tests, it is essential to distinguish between the two primary types of correlation coefficients used in research:
Pearson Correlation Coefficient: Typically used when data is measured at the interval or ratio level (continuous data) and follows a normal distribution.
Spearman Rank Correlation Coefficient: A non-parametric alternative used when data is at the ordinal level (ranked data) or when the assumptions of normality are not met.
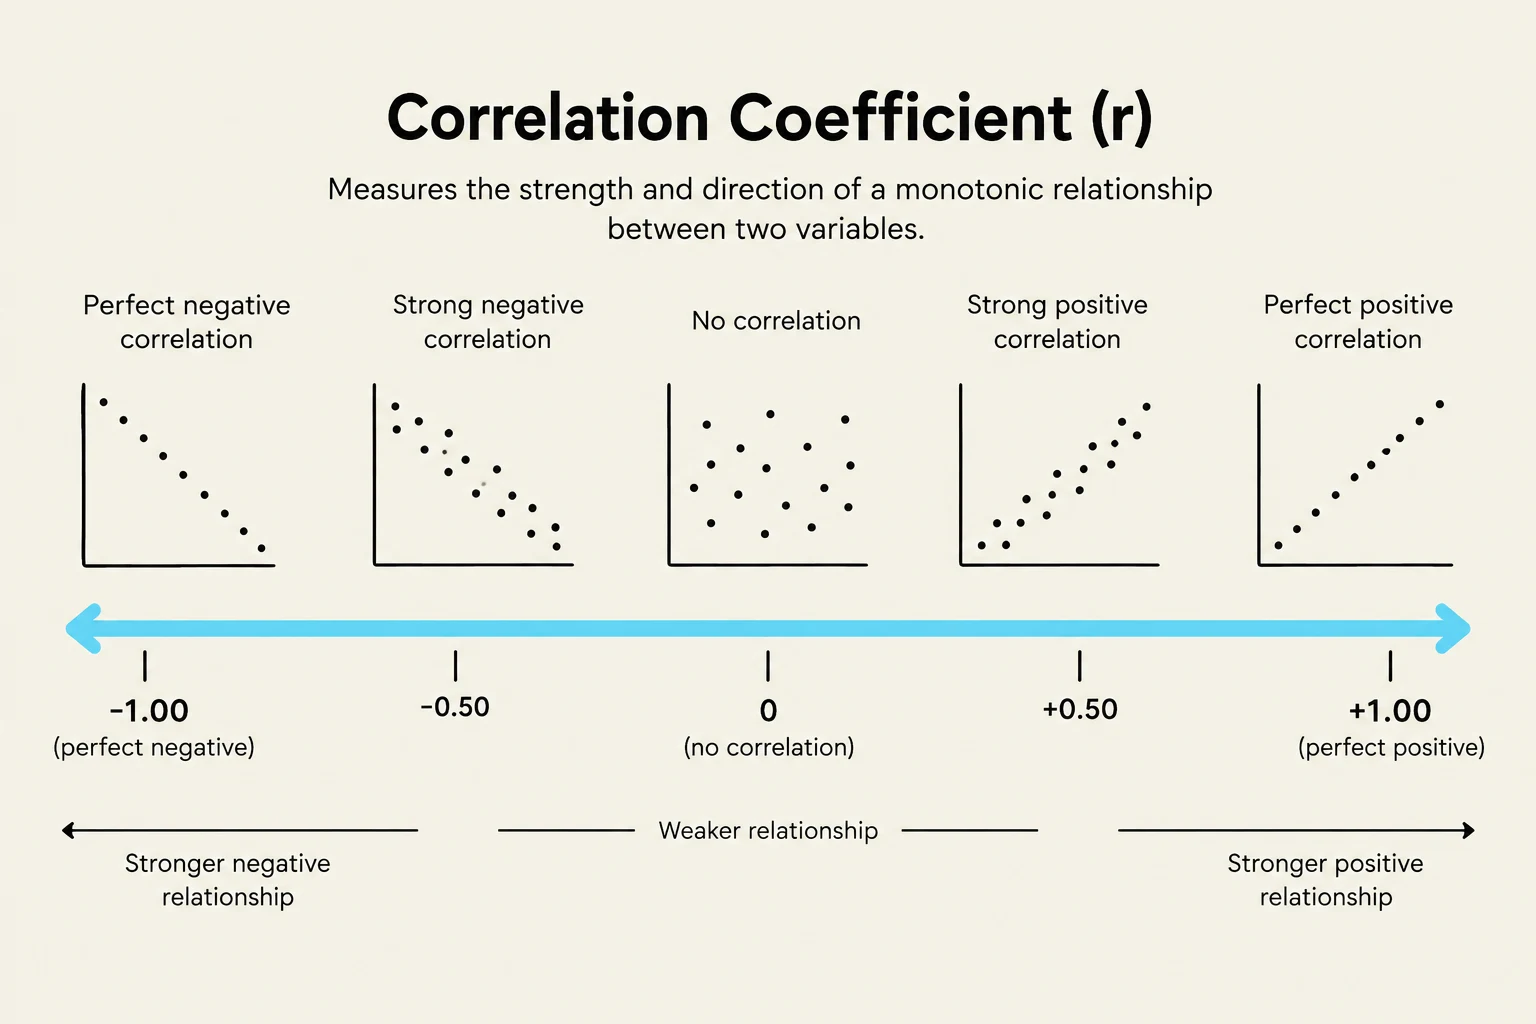
The value of a correlation coefficient always ranges from −1.00 to +1.00.
A value of +1.00 indicates a perfect positive relationship.
A value of −1.00 indicates a perfect negative relationship.
A value of 0 indicates no relationship at all.
This illustration shows different types of correlation coefficients, ranging from perfect negative correlation (-1.00) to perfect positive correlation (+1.00), with no correlation at 0. It visually represents how the strength and direction of a monotonic relationship between two variables are measured.
The Spearman Rank Correlation Coefficient
The Spearman rank correlation coefficient is particularly useful in clinical and social science research where variables might be measured on an ordinal scale—such as pain scales (mild, moderate, severe) or Likert scales (strongly disagree to strongly agree).
Key Assumptions
To ensure the results of a Spearman correlation are valid, certain statistical assumptions must be considered:
Independence: The observations in the sample must be independent of one another.
Ordinal Data: The variables should be at least ordinal in nature.
Normality (Contextual): While Spearman is a non-parametric test (meaning it does not require the data to follow a normal distribution), it is often chosen specifically when the assumption of normality required for the Pearson test is violated.
The Framework of Hypothesis Testing
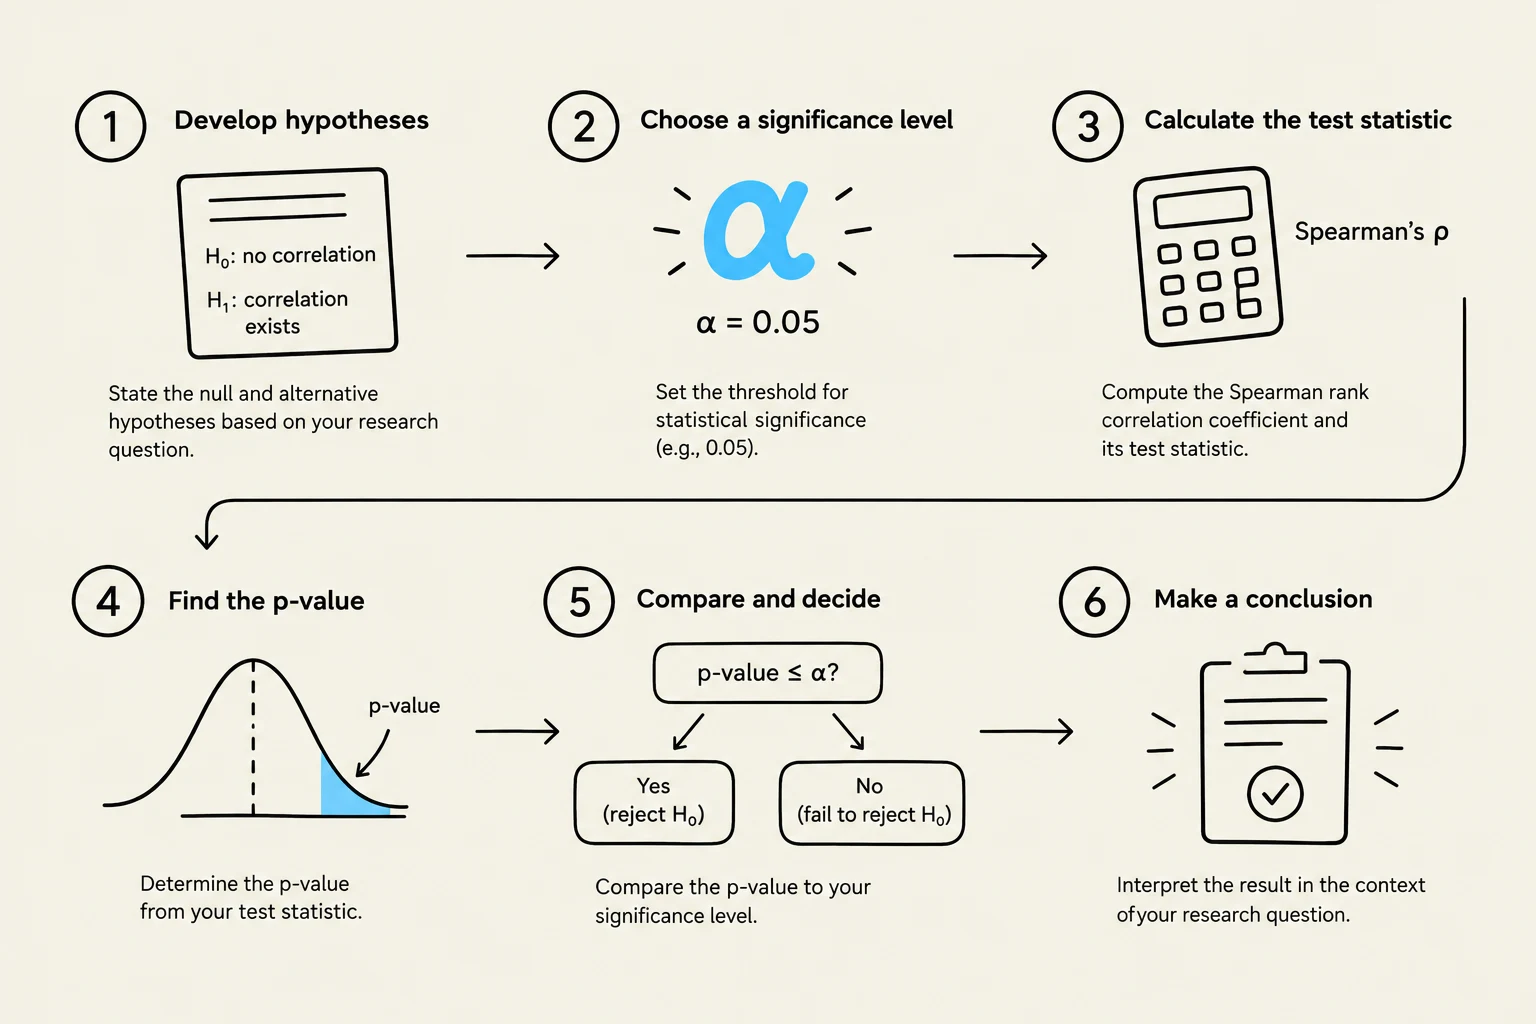
To determine if a correlation observed in a sample is actually meaningful or just a result of random chance, researchers employ hypothesis testing. This process follows a rigorous six-step sequence:
Develop Hypotheses: Create a null and a research hypothesis.
Choose a Level of Significance: Decide on the threshold for error (usually α=0.05).
Determine the Appropriate Test: Select the test (e.g., Spearman) based on data type.
Run Analysis: Calculate the test statistic and the p-value.
Make a Decision: Decide whether to reject or fail to reject the null hypothesis.
Make a Conclusion: Interpret the findings in the context of the research.
Defining the Hypotheses
In any statistical test, we must define two opposing statements:
Null Hypothesis (H0): This is the "no effect" statement. It posits that there is no relationship between the variables being studied.
Research Hypothesis (H1): This is the statement the researcher is actually trying to support. It posits that a relationship does exist between the variables.
This flowchart illustrates the six steps involved in hypothesis testing, from developing hypotheses to making a conclusion, including choosing a significance level, calculating test statistics, finding the p-value, and comparing results.
Exam Tip: Always remember that the goal of hypothesis testing is to see if there is enough evidence to "reject the null hypothesis." If your p-value is very small, you are essentially saying, "It is very unlikely this happened by chance, so I reject the idea that there is no relationship."
Worked Example: Anxiety and Self-Esteem
Let's apply these concepts to a practical scenario. Imagine a researcher wants to study whether there is a relationship between subjects' anxiety scores and their scores on a self-esteem scale.
Step 1: Formulate Hypotheses
Null Hypothesis (H0): There will be no relationship between anxiety score and self-esteem score.
Research Hypothesis (H1): There will be a relationship between anxiety score and self-esteem score.
Step 2: Set Significance and Run Test
The researcher chooses a level of significance of α=0.05. Because the scores are ordinal, the Spearman Rank Correlation Coefficient is used.
Step 3: Interpret the Results
Suppose the analysis yields the following results:
Test Statistic (Correlation Coefficient):r=−0.392
P-value:p<0.000
To make a decision, we compare the p-value to our level of significance (α):
p<0.000<α=0.05
Since the p-value is less than 0.05, we reject the null hypothesis.
Final Conclusion
Because we rejected the null hypothesis, we conclude that there is a significant negative relationship between anxiety and self-esteem.
In practical terms, a negative correlation means the variables move in opposite directions:
When anxiety is higher, self-esteem tends to be lower.
When anxiety is lower, self-esteem tends to be higher.
Keep reading for free.
Create an account to finish this reading and make it part of your study routine.