Understanding the Risk-Return Tradeoff and Portfolio Diversification
Explore the fundamental concept of the risk-return tradeoff in finance, including how to measure individual asset performance (expected return, variance, standard deviation) and understand asset relationships (covariance, correlation). Learn about portfolio theory, including portfolio expected return and variance, and
In the world of finance, every potential reward comes with a cost: uncertainty. This fundamental concept is known as the Risk-Return Tradeoff. To manage investments effectively, one must not only understand how much an asset might earn but also how much that return might fluctuate. By mastering the statistical tools used to measure these fluctuations and understanding how assets interact within a group, investors can construct portfolios that optimize their specific goals.
Measuring Individual Asset Performance
Before building a portfolio, we must define how we measure the "reward" and the "risk" of a single asset.
Expected Return
The Expected Return (E(Ri)) is the mean value of a sequence of historical returns. If we observe returns over T periods, we calculate it by summing all observations and dividing by the total number of periods:
E(Ri,t)=T1t=1∑TRi,t
For example, if NVIDIA's monthly returns over a year are averaged, the resulting figure represents the expected return for that period.
Variance and Standard Deviation
Risk is essentially a measure of how much the actual realized return differs from the expected return. We quantify this using two related measures:
Variance (σi2): The average of the squared deviations from the mean.
σi2=T1∑t=1T(Ri−E(Ri))2
Standard Deviation (σi): The square root of the variance. In finance, this is commonly referred to as volatility.
Exam Tip: Remember that while variance is mathematically useful, standard deviation is often preferred in reporting because it is expressed in the same units (percentage) as the returns themselves.
Understanding Asset Relationships
When managing multiple assets, it is not enough to know how they behave individually; we must know how they move in relation to one another.
Covariance and Correlation
Covariance (σi,j) measures the degree to which two assets move together.
If σi,j>0, the assets tend to move in the same direction.
If σi,j<0, the assets tend to move in opposite directions, which can help offset losses.
Because covariance can be difficult to interpret due to its scale, we use Correlation (ρi,j) to standardize the relationship. Correlation is a scaled version of covariance that always falls between −1 and 1:
ρi,j=σiσjσi,j
ρ=1 (Perfect Positive): The assets move in perfect lockstep.
ρ=0 (No Correlation): There is no linear relationship between the assets.
ρ=−1 (Perfect Negative): The assets move in exactly opposite directions.
Portfolio Theory: Return and Risk
A portfolio is a collection of assets, each weighted by the proportion of total wealth invested in it (Xi).
Portfolio Expected Return
The expected return of a portfolio (E(Rp)) is simply the weighted average of the expected returns of the individual assets:
E(Rp)=∑i=1NXiRi
Portfolio Variance and Risk
Unlike return, Portfolio Variance (σp2) is not a simple weighted average of individual variances. It must account for the way assets covary. For a two-asset portfolio, the formula is:
σp2=X12σ12+X22σ22+2X1X2ρ1,2σ1σ2
The final Portfolio Risk is the standard deviation of this variance: σp=σp2.
The Power of Diversification
Diversification is the process of reducing risk by investing in assets that do not move perfectly together. The effectiveness of this strategy depends entirely on the correlation (ρ) between assets.
Figure: Risk Return Trade-off: Portfolios of N=2 Assets
As shown in the figure above, different correlations create different "frontiers" of possible outcomes:
Perfect Positive Correlation (ρ=1): The frontier is a straight line. No risk reduction is achieved through diversification.
No Correlation (ρ=0): The frontier curves toward the left, indicating that risk can be reduced for a given level of return.
Perfect Negative Correlation (ρ=−1): The frontier reaches all the way to the vertical axis. In this theoretical scenario, it is possible to construct a Minimum Variance Portfolio with zero risk.
Diversifying Across Many Assets
What happens if we move beyond two assets? If we invest equally in N stocks, the portfolio variance can be expressed as:
σp2=N1σˉi2+NN−1σˉi,k
As the number of assets N approaches infinity (N→∞), the first term (representing individual security risk) approaches zero. This means that idiosyncratic risk (risk specific to a single company) can be diversified away, leaving only systemic market risk.
The graph shows the relationship between the number of assets in a portfolio and its risk. As the number of assets increases, the portfolio risk decreases.Figure: Average Risk of Equally Weighted Portfolios
The Efficient Frontier and Investor Preferences
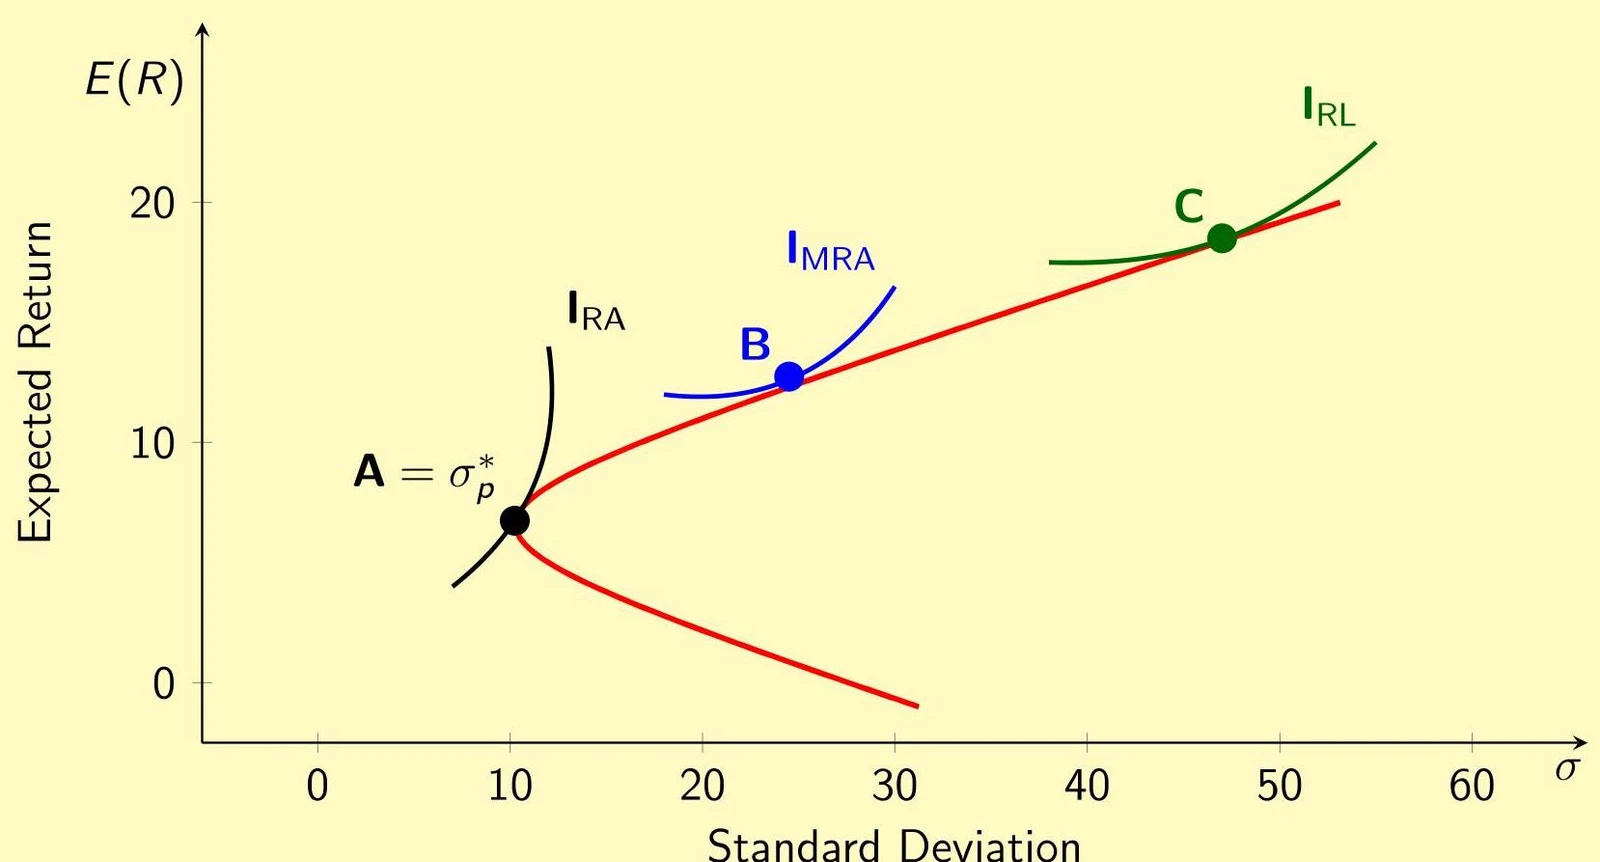
When we plot all possible combinations of assets on a graph of Expected Return vs. Standard Deviation, we create the Mean-Standard Deviation Frontier.
Efficient vs. Inefficient Portfolios
Efficient Portfolios: These lie on the upper segment of the frontier. They represent the maximum possible return for a given level of risk.
Inefficient Portfolios: These lie on the lower segment. An investor would never choose these because they could achieve a higher return for the same amount of risk by moving to the upper segment.
Individual Risk Aversion
While the Efficient Frontier tells us what is possible, an investor's personal preferences tell us what is optimal. We use indifference curves to represent these preferences. An indifference curve connects points that provide the same level of "utility" or happiness to an investor.
The slope of these curves represents an investor's risk aversion:
High Risk Aversion: Very steep curves. These investors require a massive increase in expected return to accept even a small increase in risk.
Low Risk Aversion: Flatter curves. These investors are willing to accept more risk for relatively small increments in return.
The optimal portfolio for any specific investor is found at the point where their highest possible indifference curve is tangential to the efficient frontier.
A graph illustrating the relationship between expected return and standard deviation, showing different investment curves like the Capital Market Line and indifference curves.Figure: Portfolio Choice and Risk Aversion
Keep reading for free.
Create an account to finish this reading and make it part of your study routine.