Understanding the Consumer Budget Constraint in Microeconomics
This content explains the consumer budget constraint, a fundamental concept in microeconomics. It details the budget set, budget line, how changes in income and prices affect them, and the impact of government policies like taxes and subsidies. The explanation uses a two-good model and discusses opportunity cost and th
In the study of microeconomics, we often want to understand how individuals make decisions. A central question is: how do consumers choose the "best" combination of goods they can afford? To answer this, we must first define the boundaries of what is actually possible. This boundary is known as the budget constraint. It represents the mathematical limit of a consumer's purchasing power, dictated by their available income and the market prices of goods.
The Fundamentals of the Budget Constraint
To analyze consumer behavior, economists typically use a simplified model known as the two-good assumption. While consumers in the real world buy thousands of different items, assuming only two goods allows us to represent choices graphically on a two-dimensional plane.
A consumer's choice is represented by a consumption bundle, denoted as (x1,x2), where x1 is the quantity of good 1 and x2 is the quantity of good 2. To determine what a consumer can afford, we need three parameters:
p1: The price of good 1.
p2: The price of good 2.
m: The consumer's total income or money available to spend.
The formal budget constraint is expressed by the following inequality:
p1x1+p2x2≤m
This inequality states that the total expenditure on good 1 (p1x1) plus the total expenditure on good 2 (p2x2) must be less than or equal to the total income m.
The Budget Set and the Budget Line
The collection of all affordable consumption bundles—those that satisfy the inequality above—is called the budget set. If a consumer spends exactly all of their income, they are on the budget line, defined by the equation:
p1x1+p2x2=m
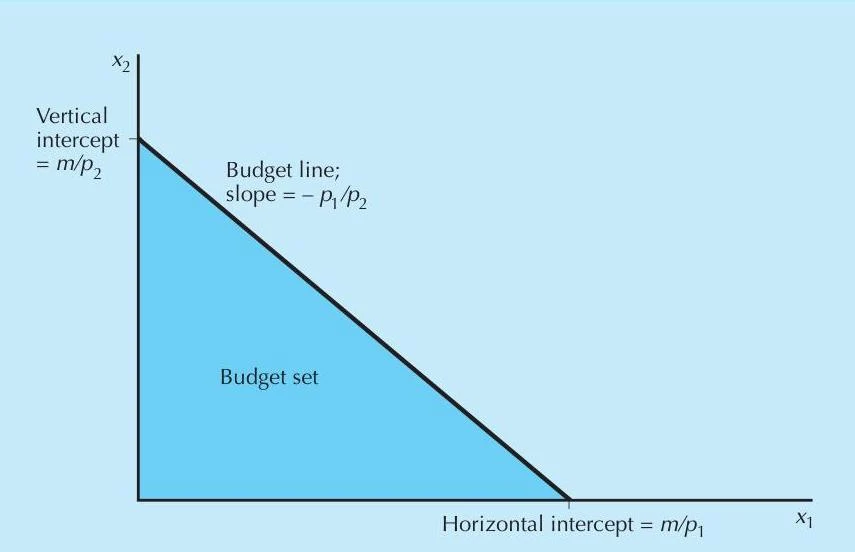
The budget set can be visualized as the area on a graph bounded by this line. Bundles located on the line cost exactly m, while bundles below the line cost less than m and are also affordable.
A budget set graph illustrating the trade-off between two goods, x1 and x2, given prices p1 and p2, and income m. The budget line shows all possible combinations of goods that can be purchased, and the budget set represents all affordable combinations.
Figure 1: The budget set. The budget set consists of all bundles that are affordable at the given prices and income.
Analyzing the Slope and Intercepts
A budget line is a straight line that can be rearranged into a slope-intercept form:
x2=p2m−p2p1x1
This formula provides two critical pieces of information:
The Intercepts: The vertical intercept (m/p2) represents the maximum amount of good 2 the consumer could buy if they spent all their money on it. The horizontal intercept (m/p1) represents the maximum amount of good 1 they could buy.
The Slope: The slope of the budget line is −p1/p2.
Economic Insight: Opportunity Cost
The slope of the budget line measures the rate at which the market is willing to "substitute" one good for another. Economists often describe this slope as the opportunity cost of consuming good 1. To consume one more unit of good 1, the consumer must give up a certain amount of good 2.
The Composite Good Interpretation
One of the most powerful ways to use the two-good model is through the composite good interpretation. If we are interested in the demand for one specific good (like milk), we can let x1 represent milk and let x2 represent "everything else."
In this scenario, x2 is measured in dollars. Because the "price" of one dollar is exactly one dollar, p2 becomes 1. This simplifies the budget constraint to:
p1x1+x2≤m
This allows economists to study the demand for a single specific good by treating all other potential expenditures as a single, aggregate variable.
How the Budget Constraint Shifts
The budget set is not static; it changes whenever income or prices change.
Changes in Income
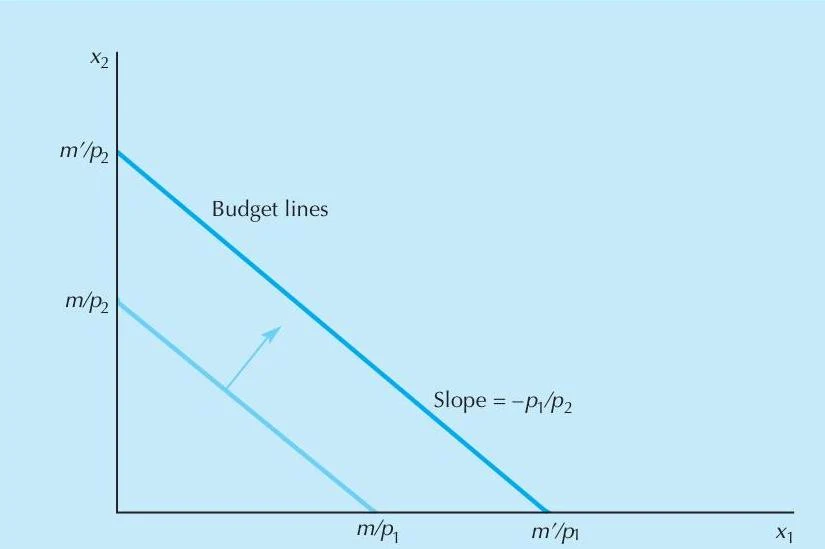
An increase in income m shifts the budget line outward in a parallel fashion, meaning the consumer can afford more of both goods, but the relative prices (the slope) remain the same. Conversely, a decrease in income shifts the line inward.
This graph illustrates budget lines in economics, showing the trade-off between two goods (x1 and x2) given income and prices. The slope represents the ratio of prices.
Figure 2: Increasing income. An increase in income causes a parallel shift outward of the budget line.
Changes in Prices
When the price of a good changes, the budget line "tilts."
If p1 increases: The horizontal intercept (m/p1) moves inward, making the budget line steeper.
If p2 increases: The vertical intercept (m/p2) moves inward, making the budget line flatter.
Exam Tip: Balanced Inflation
If all prices and all incomes increase by the same proportion (e.g., everything doubles), the budget line does not change. This is because the ratio of prices and the ratio of income to prices remain constant.
Policy Impacts: Taxes, Subsidies, and Rationing
Government interventions can alter the budget constraint by changing the effective prices or the available income.
Taxes: A quantity tax (like a gas tax) increases the price of a good, making the budget line steeper. A value tax (like sales tax) also increases the effective price. A lump-sum tax reduces total income, shifting the entire budget line inward.
Subsidies: These are the opposite of taxes. A quantity subsidy decreases the effective price, making the budget line flatter. A lump-sum subsidy increases income, shifting the line outward.
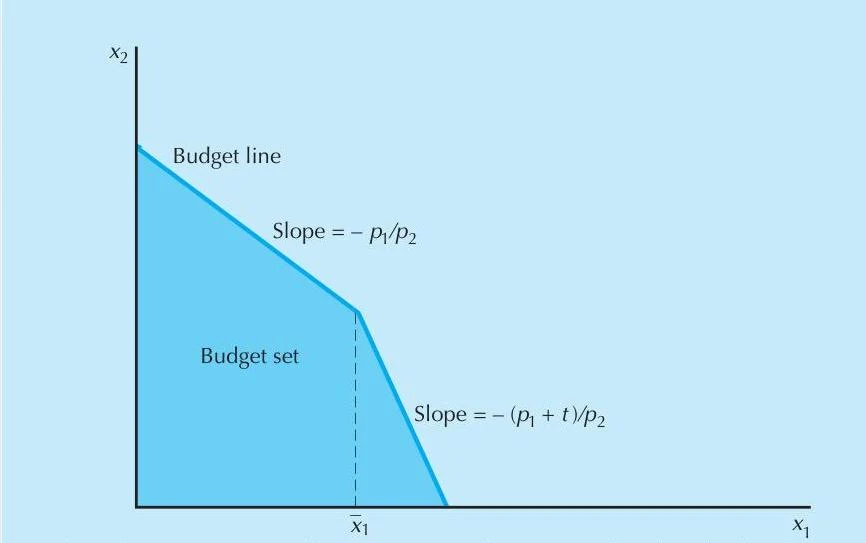
Rationing: If the government limits the consumption of a good to a maximum amount (xˉ1), the budget set is "lopped off," meaning any bundles where x1>xˉ1 are no longer part of the budget set.
A graph illustrating a budget set and budget line in economics, showing how the slope changes with different price ratios.
Figure 3: Budget set with rationing.
By understanding these shifts, economists can predict how policy changes—such as the Food Stamp program—will impact the purchasing power and consumption patterns of different households.
Keep reading for free.
Create an account to finish this reading and make it part of your study routine.