


In statistical modeling, regression analysis serves as a fundamental tool for understanding the relationships between variables. Whether we are looking at how age influences work hours or how religious affiliation might impact lifestyle choices, regression allows us to quantify these connections and predict outcomes. This article breaks down the components of linear regression models using a dataset containing variables such as Workhrs (work hours), Religious, and Age.
Starting with Descriptive Data Analysis
Before running a regression model, it is essential to perform descriptive data analysis. This process involves summarizing the basic features of the data to understand its distribution, central tendency, and spread.
For instance, when examining numeric variables like Workhrs and Age, we look at the mean, standard deviation, and the range (minimum and maximum values). For example, in our dataset, Workhrs has a mean of 18.22 with a standard deviation of 16.2, while Age has a mean of 48.28. For categorical or discrete variables like Religious, we often use frequency distributions and histograms to visualize how the data is spread across different categories.
The Mechanics of Linear Regression
Linear regression is a method used to model the relationship between a dependent variable (the outcome we want to predict) and one or more independent variables (the predictors).
In our analysis, we progress through three levels of complexity:
- Simple Linear Regression (Model 1): Predicting
Workhrsusing onlyReligious. - Multiple Linear Regression (Model 2): Predicting
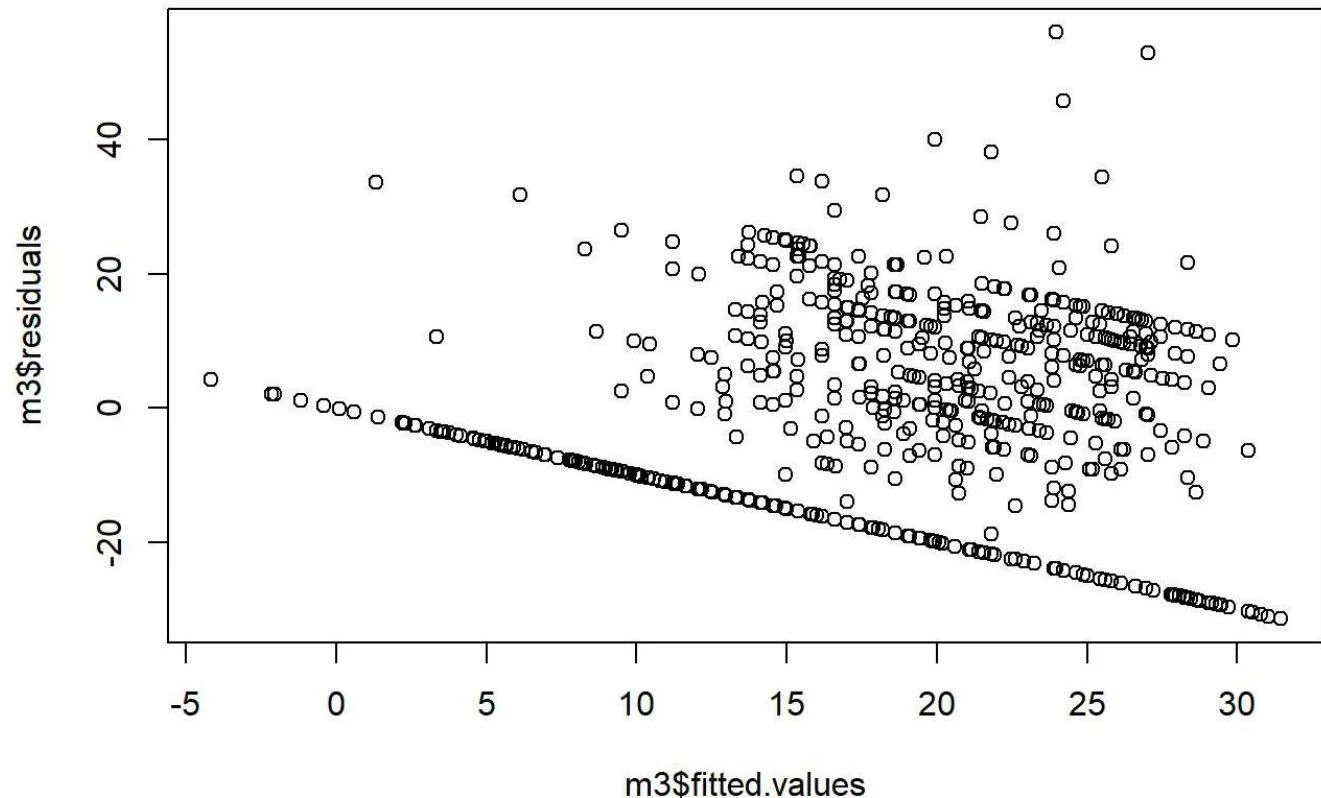
Workhrsusing bothReligiousandAge. - Moderation Model (Model 3): Testing if the effect of
ReligiousonWorkhrschanges depending on the level ofAgeby including an interaction term (Religious * Age).
Keep reading for free.
Create an account to finish this reading and make it part of your study routine.
Continue reading freeAlready have an account? Log in
Updated