An explanation of price elasticity of demand (PED), its calculation, interpretation, determinants, and its relationship with total revenue. It also covers other types of elasticity and the impact of government price controls.
In economics, we often observe that when the price of a product changes, the amount people want to buy also changes. However, not all products react to price changes in the same way. Some goods see a massive drop in sales when prices rise slightly, while others see almost no change at all. To measure this phenomenon, economists use the concept of elasticity.
Elasticity is defined as the responsiveness of one variable to a change in another variable. While there are many types of elasticity, such as the elasticity of supply or income elasticity, the most common application is understanding how consumers react to price fluctuations.
The Concept of Elasticity
At its core, elasticity helps us understand how markets respond to changes in demand or supply. One of the fundamental principles driving these changes is the Law of Demand, which proposes an inverse relationship between price and quantity demanded for most goods. This means that, generally, as price increases, the quantity demanded decreases.
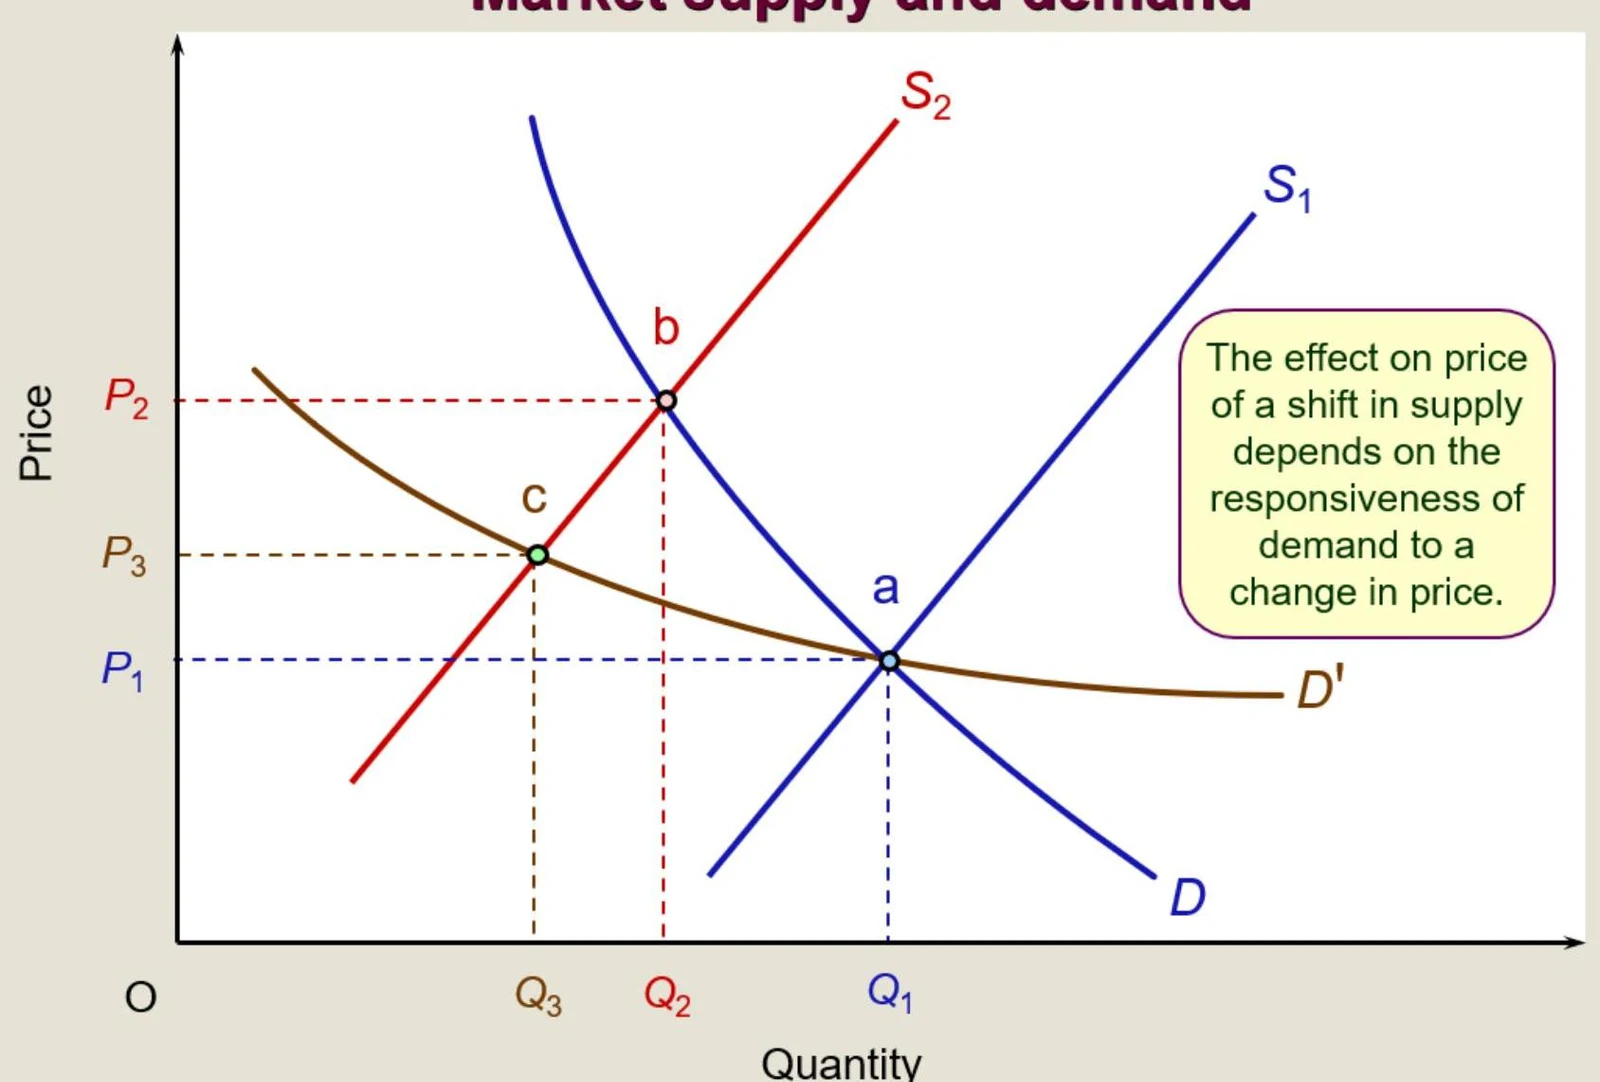
Price elasticity of demand (PED) specifically investigates the extent to which that quantity demanded changes in response to a change in price. It is important to note that a change in price is often triggered by a change in supply, which shifts the supply curve.
Measuring Price Elasticity of Demand (PED)
To calculate PED, we compare the size of the change in quantity demanded with the size of the change in price. Because demand curves are typically downward sloping, an increase in price leads to a fall in quantity demanded, resulting in a negative PED value.
Example 1: Elastic Demand
If the price rises from 10 to 12 (a 20% increase) and the quantity demanded decreases from 200 to 120 (a 40% decrease), the calculation is:
PED=20%−40%=−2.00
Example 2: Inelastic Demand
If the price rises from 40 to 50 (a 25% increase) and the quantity demanded decreases from 90 to 75 (a 16.66% decrease), the calculation is:
PED=25%−16.66%=−0.66
Interpreting the Values
When interpreting PED, economists often ignore the negative sign and look at the absolute value to determine the type of demand:
Price Elastic Demand ($|PED| > 1$): A change in price causes a proportionately greater change in quantity demanded.
Price Inelastic Demand ($|PED| < 1$): A change in price causes a proportionately smaller change in quantity demanded.
Unit Elasticity ($|PED| = 1$): Price and quantity demanded change by the exact same proportion.
This graph illustrates the relationship between market supply and demand, showing how shifts in supply affect price based on demand responsiveness.
Determinants of PED
Why are some goods more elastic than others? Three main factors determine the responsiveness of demand:
Number and Closeness of Substitutes: This is the most important determinant. If many close substitutes exist, consumers can easily switch to another product if the price rises, making demand elastic. For example, "beef" has many substitutes (chicken, lamb, pork), making it more elastic than "meat" as a broad category.
Proportion of Income Spent on the Product: If a good accounts for a large portion of a consumer's income (like a mortgage), the demand tends to be more elastic. Conversely, goods that cost very little (like salt) have inelastic demand.
Time Period: Demand tends to be more elastic over longer periods. In the short run, consumers may be stuck with current habits or technology (like petrol for cars), but in the long run, they can find alternatives (like electric vehicles).
PED and Total Revenue
Understanding PED is vital for a firm's pricing strategy because it dictates how price changes affect Total Revenue (TR)—which, from the consumer's perspective, is the same as Total Consumer Expenditure (TE).
Elastic Demand: Since quantity changes more than price, a price increase will cause total revenue to fall, while a price decrease will cause total revenue to rise.
Inelastic Demand: Since quantity changes less than price, a price increase will lead to an increase in total revenue, and a price decrease will lead to a decrease in total revenue.
Unit Elasticity: Total revenue remains unchanged regardless of price changes.
Exam Tip: Remember that Total Expenditure is calculated as Price × Quantity (P×Q).
Other Types of Elasticity
While PED focuses on price, economists also study other relationships:
Cross-Price Elasticity of Demand (CED): This measures how the demand for one good responds to a change in the price of another good.
Substitutes have a positive CED (if the price of grapes rises, demand for apples increases).
Complements have a negative CED (if the price of bread rises, demand for butter decreases).
Income Elasticity of Demand (YED): This measures responsiveness to changes in real income.
Normal Goods have a positive YED (demand rises as income rises).
Inferior Goods have a negative YED (demand falls as income rises).
Government Intervention: Price Controls
Sometimes, governments intervene in the market by setting prices that differ from the equilibrium price.
Price Floors (Minimum Price)
A price floor is a government-mandated minimum price set above the equilibrium. This is often used to protect producers (like farmers) or to deter the consumption of undesirable goods (like alcohol). However, a price floor typically results in a surplus, where quantity supplied exceeds quantity demanded.
Price Ceilings (Maximum Price)
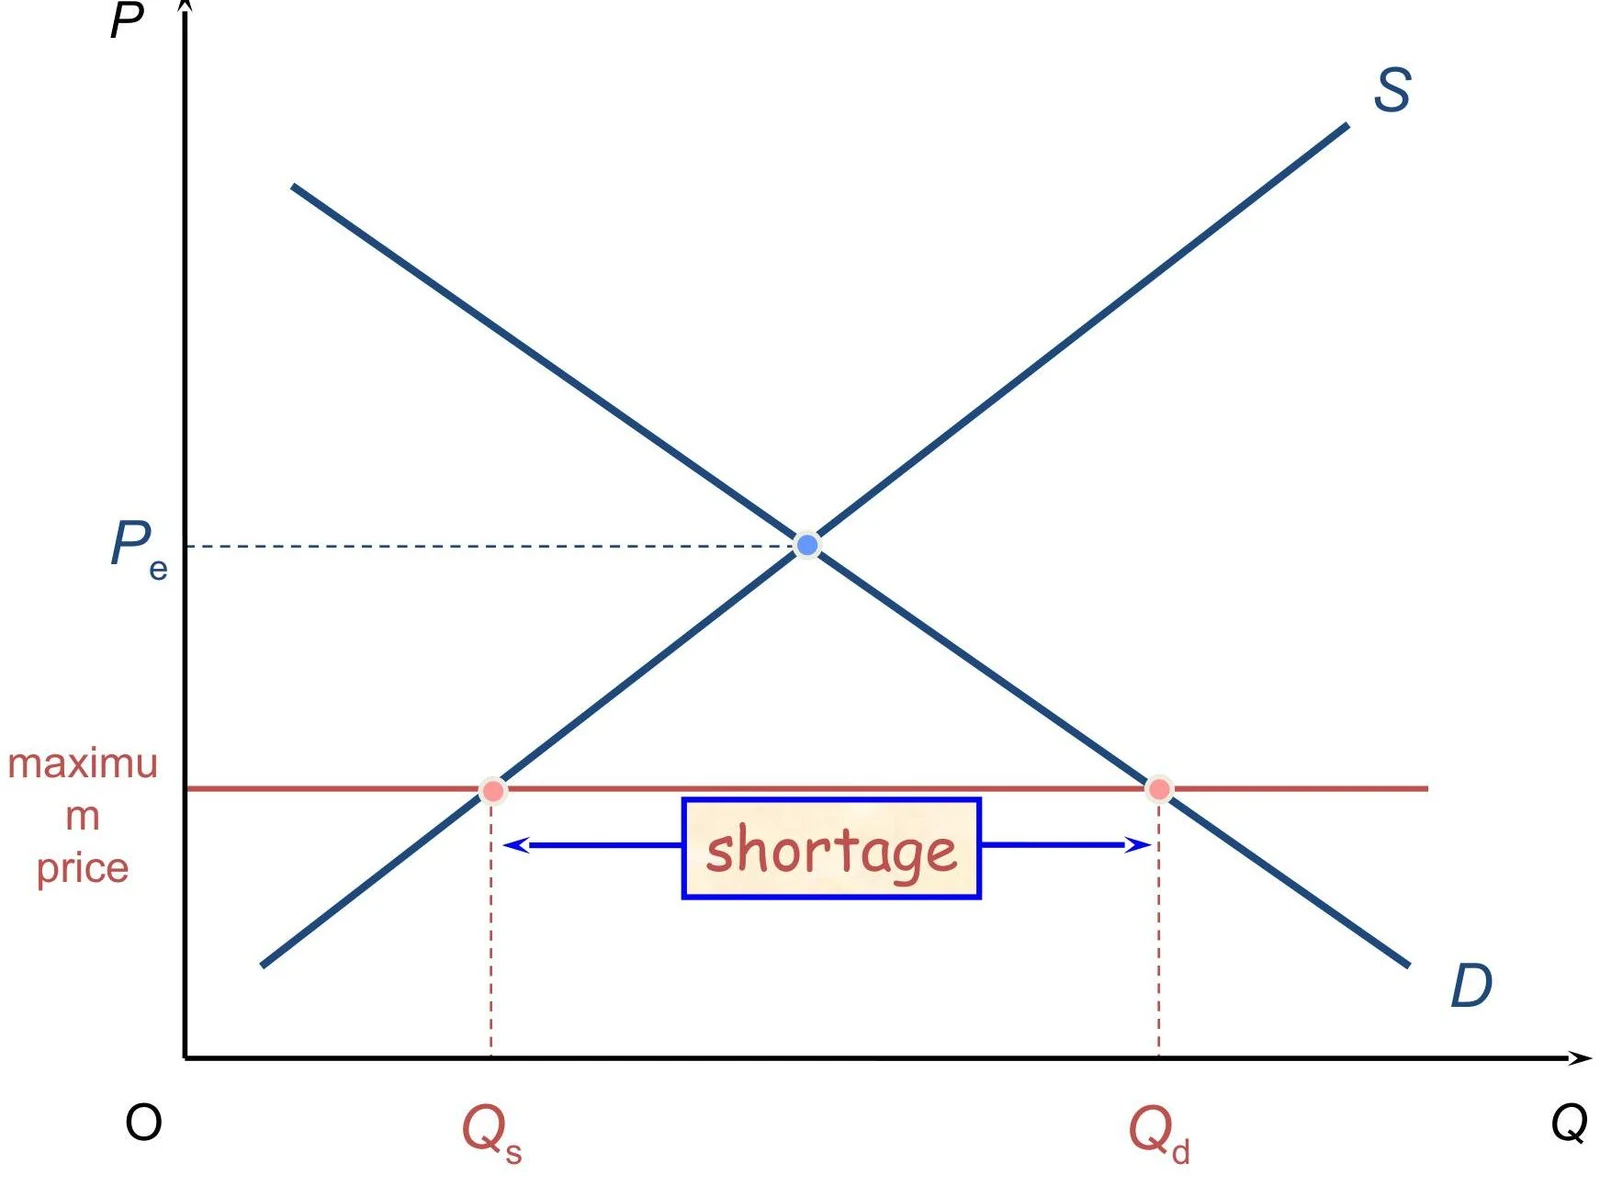
A price ceiling is a maximum price set below the equilibrium. This is often intended to protect consumers from high prices, such as in rent control. However, a price ceiling typically results in a shortage, where quantity demanded exceeds quantity supplied.
This graph illustrates a market shortage, where the quantity demanded (Qd) exceeds the quantity supplied (Qs) at a price below the equilibrium price (Pe). The horizontal red line represents a maximum price set below the equilibrium, leading to a shortage.
Critical Note: While intended to help, price controls can lead to inefficiencies, such as the emergence of illegal "black markets" or the creation of long queues and rationing.
Keep reading for free.
Create an account to finish this reading and make it part of your study routine.