Understanding Null and Alternative Hypothesis Testing
This article explains the fundamental concepts of hypothesis testing, including the null hypothesis (H0) and the alternative hypothesis (H1). It uses a practical example from a physical therapy clinic to illustrate how these hypotheses are formulated and tested to determine if observed differences in data are due to ra
In the world of science and clinical practice, we are constantly asking questions: Does this new medication work? Does this teaching method improve test scores? Does this physical therapy program enhance balance? While it is easy to look at a set of data and see a difference, we must ask ourselves a critical question: Is that difference real, or is it just a result of random chance?
Hypothesis testing provides the mathematical framework to answer this question. It is a formal process used to determine whether the evidence gathered from a sample is strong enough to reject a default assumption and support a new theory.
The Two Competing Explanations
Every hypothesis test begins with two competing ideas that stand in direct opposition to one another. To understand how these work, let's look at a real-world scenario involving a physical therapy clinic.
The Scenario:
A clinic traditionally sees patients improve by an average of 4 points on the Berg Balance Scale. They implement a new training program and, after testing 20 patients, notice the average improvement has risen to 5.5 points.
While 5.5 is higher than 4, we cannot immediately claim the new program is superior. We must weigh two specific hypotheses:
1. The Null Hypothesis (H0)
The null hypothesis, often denoted as H0, represents the idea that "nothing changed". It is the assumption that any observed difference in your data is simply due to random variation or chance. In our clinic example, the null hypothesis would state that the new balance training program performs exactly the same as the old program, and the jump from 4 to 5.5 points was just a fluke of the specific 20 patients chosen.
This illustration depicts the concept of a null hypothesis versus a data point. The null hypothesis assumes no change from a baseline state, represented by a normal distribution centered around an expected value. A data point that falls outside this distribution, particularly far from the baseline, may suggest a real effect, supporting an alternative hypothesis.
2. The Alternative Hypothesis (H1)
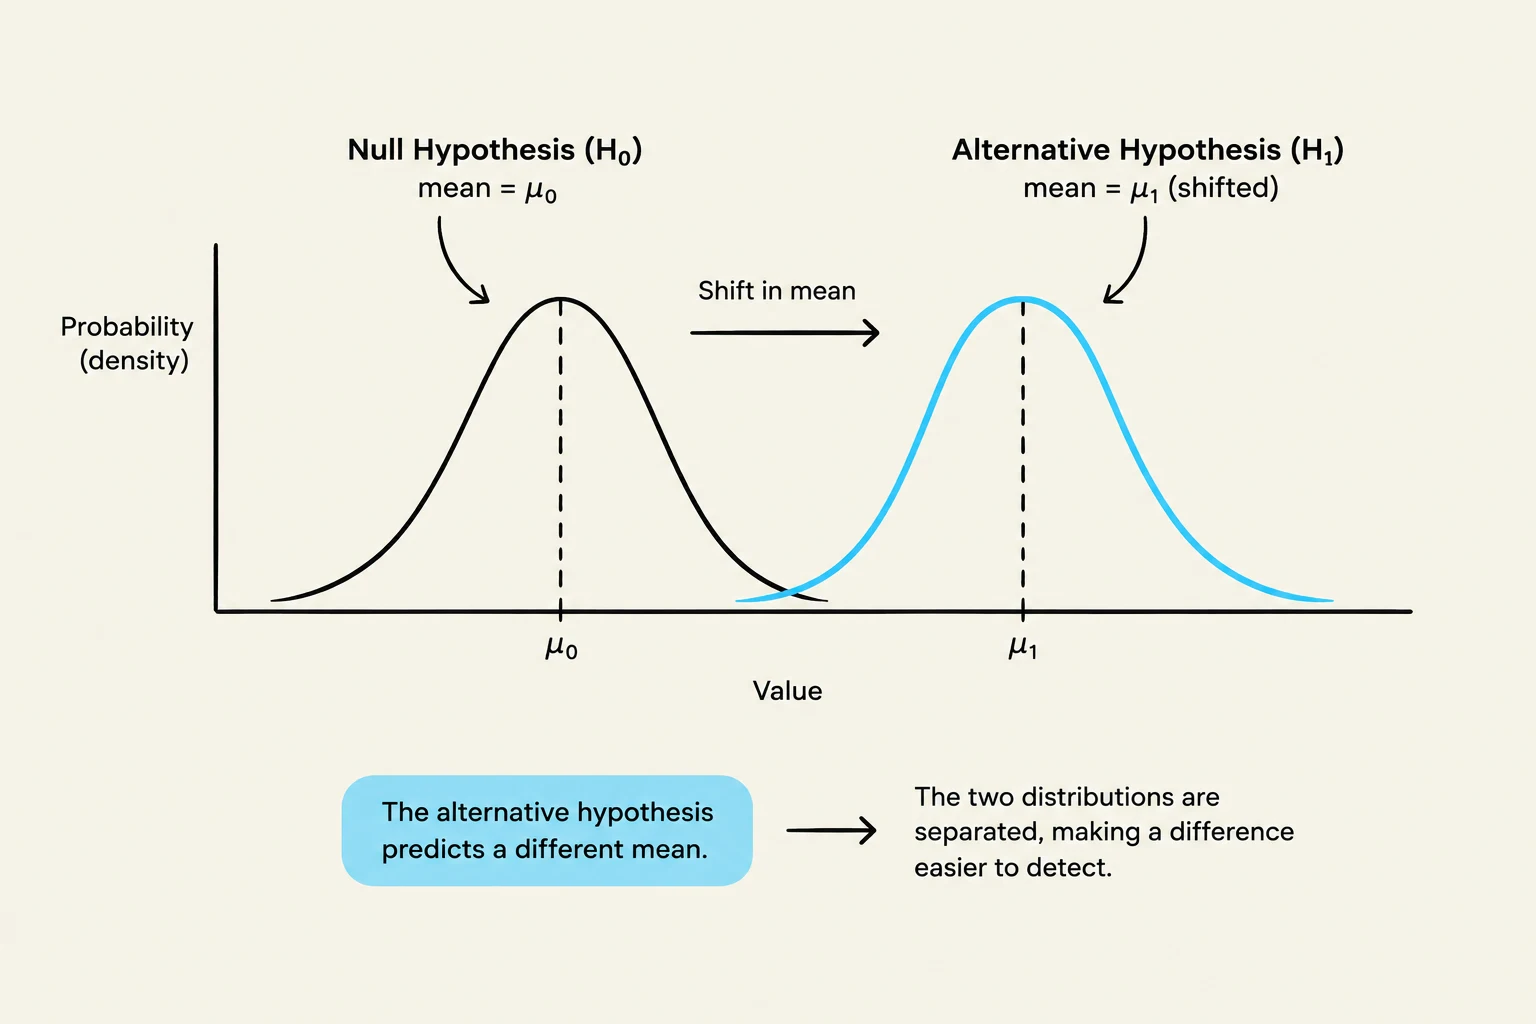
The alternative hypothesis, denoted as H1, represents the possibility that "something changed". It suggests that the observed difference is not due to chance, but is instead caused by the intervention being studied. In our example, the alternative hypothesis would state that the new balance program truly produces a different (better) outcome than the old one.
This illustration depicts two normal distributions representing a null hypothesis (H₀) and an alternative hypothesis (H₁). The shift in the mean from μ₀ to μ₁ indicates that the alternative hypothesis predicts a different mean, and the separation between the distributions makes this difference easier to detect.
The Research Hypothesis
While we must mathematically start with the null hypothesis, it is rarely the outcome we actually care about. Researchers conduct studies because they want to prove that an intervention works or that a phenomenon exists.
Because of this, the alternative hypothesis is frequently referred to as the research hypothesis. It is the possibility we are actively hoping to find evidence for.
Exam Tip: If a question asks which hypothesis represents the "effect" or the "claim" the researcher is trying to prove, they are referring to the Alternative (Research) Hypothesis.
How Hypothesis Testing Works: The Detective Approach
One of the most common mistakes students make is assuming that we start a study by trying to prove the new program works. In reality, the logic of statistics is much more conservative.
To conduct a proper hypothesis test, you must "think like a detective". When a detective investigates a crime, they do not start by assuming the suspect is guilty. Instead, they begin from a neutral position—assuming the suspect is innocent—and then look for overwhelming evidence to prove otherwise.
Hypothesis testing follows this exact same logic:
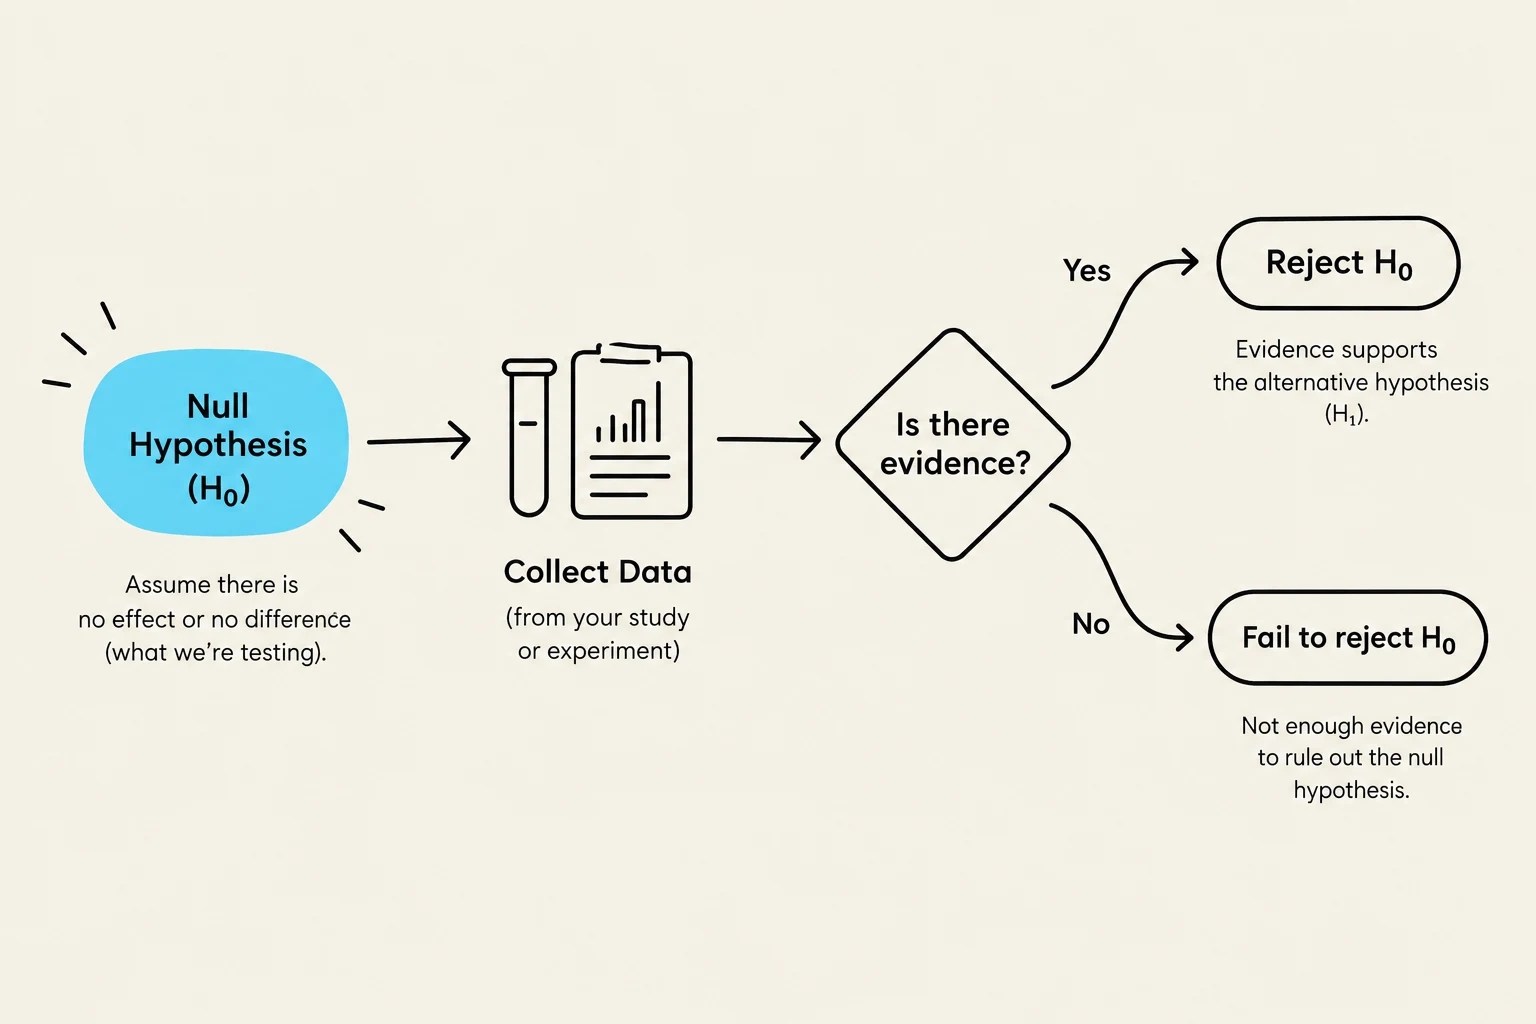
Assume the Null is true: We begin by assuming nothing changed and the new program is no better than the old one.
Gather Evidence: We collect data and perform statistical calculations.
Evaluate the Evidence: We ask: "Is this evidence strong enough to doubt our initial assumption?".
The Decision Rule
The outcome of the test leads to one of two conclusions:
If the evidence is weak: We fail to reject the null hypothesis. We continue to support the idea that nothing changed.
If the evidence is strong: We reject the null hypothesis and move toward supporting the alternative hypothesis.
This flowchart illustrates the process of hypothesis testing, starting with the null hypothesis and collecting data to determine whether to reject or fail to reject it based on the evidence.
Summary Table
Concept
Symbol
Core Idea
Clinical Example
Null Hypothesis
H0
Nothing changed; difference is due to chance.
The new program is the same as the old one.
Alternative Hypothesis
H1
Something changed; the effect is real.
The new program is better than the old one.
Research Hypothesis
H1
The specific effect the researcher seeks to find.
The new program improves balance.
By mastering these foundations, you will be able to navigate more complex statistical tests, always remembering that the goal is to determine if our evidence is strong enough to move from the "status quo" of the null to the "discovery" of the alternative.
Keep reading for free.
Create an account to finish this reading and make it part of your study routine.