


Have you ever wondered how to determine if a test score of 85 is actually "good"? If the class average was 80, an 85 might seem impressive. However, if the scores were very tightly packed around the mean, that 85 might actually be quite common. Conversely, if the scores were widely spread out, an 85 might be quite average. To answer these questions, statisticians use a powerful tool called the z-score, which allows us to understand a value's position relative to the rest of the group.
The Foundation: Mean and Standard Deviation
To understand z-scores, we must first understand the two pillars of descriptive statistics: the mean and the standard deviation.
The mean () represents the arithmetic average of a distribution. It acts as the "center" or balance point of the data.
The standard deviation () measures the spread or dispersion of the data. It tells us how much, on average, the individual values deviate from the mean. A small standard deviation indicates that most values are clustered closely around the mean, while a large standard deviation indicates that the values are spread far apart.
Understanding the Normal Distribution
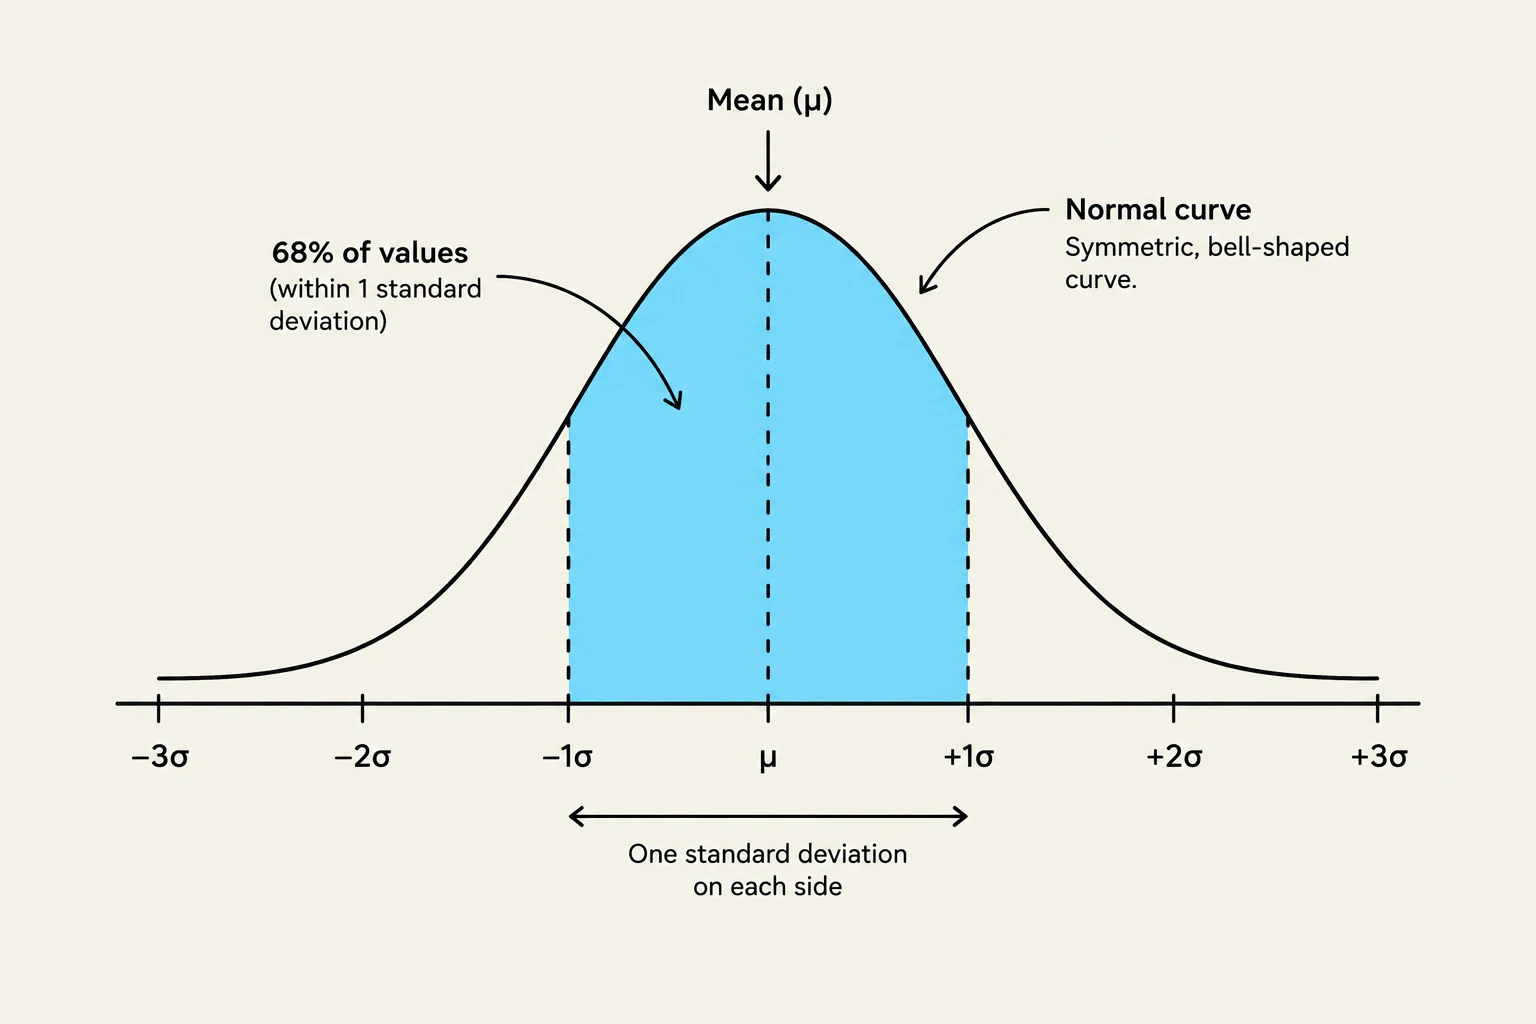
In many social sciences, we encounter data that follows a specific pattern known as the normal distribution. When visualized, this distribution forms a symmetric, bell-shaped normal curve.
The normal curve has several unique properties:
- Symmetry: The curve is perfectly symmetrical around the mean.
- Central Tendency: In a perfect normal distribution, the mean, median, and mode are all equal.
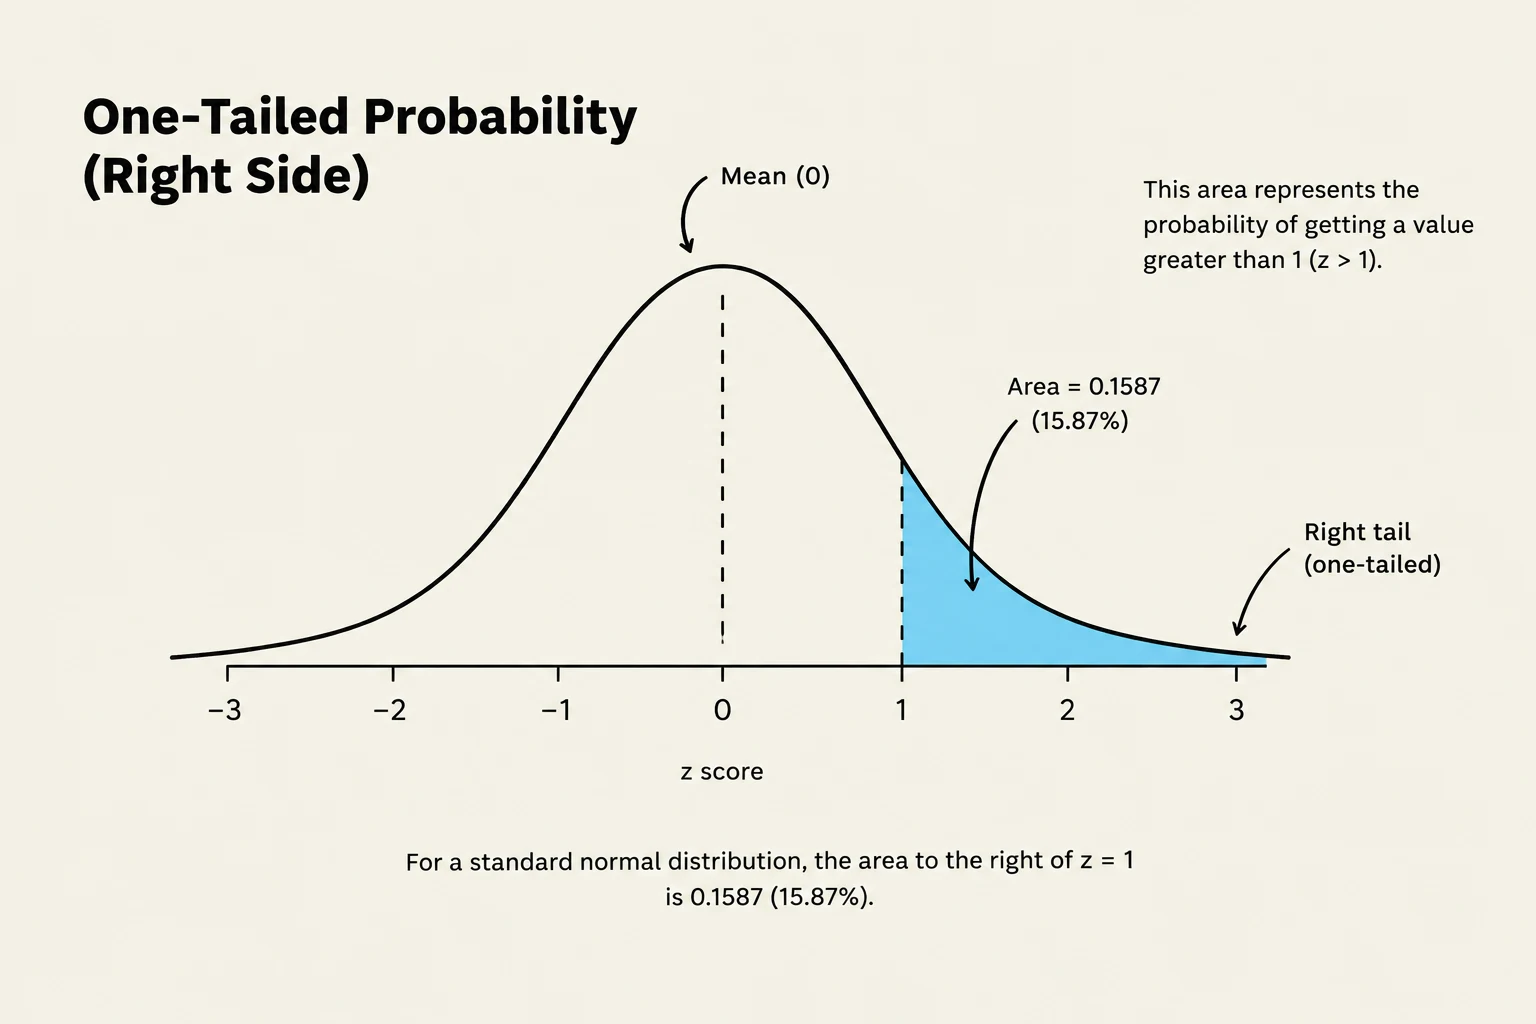
- Area under the curve: The total area under the curve represents 100% of the data.
- The Empirical Rule: Approximately 68% of values fall within one standard deviation of the mean, 95% fall within two, and 99.7% fall within three.

Keep reading for free.
Create an account to finish this reading and make it part of your study routine.
Continue reading freeAlready have an account? Log in
Updated