


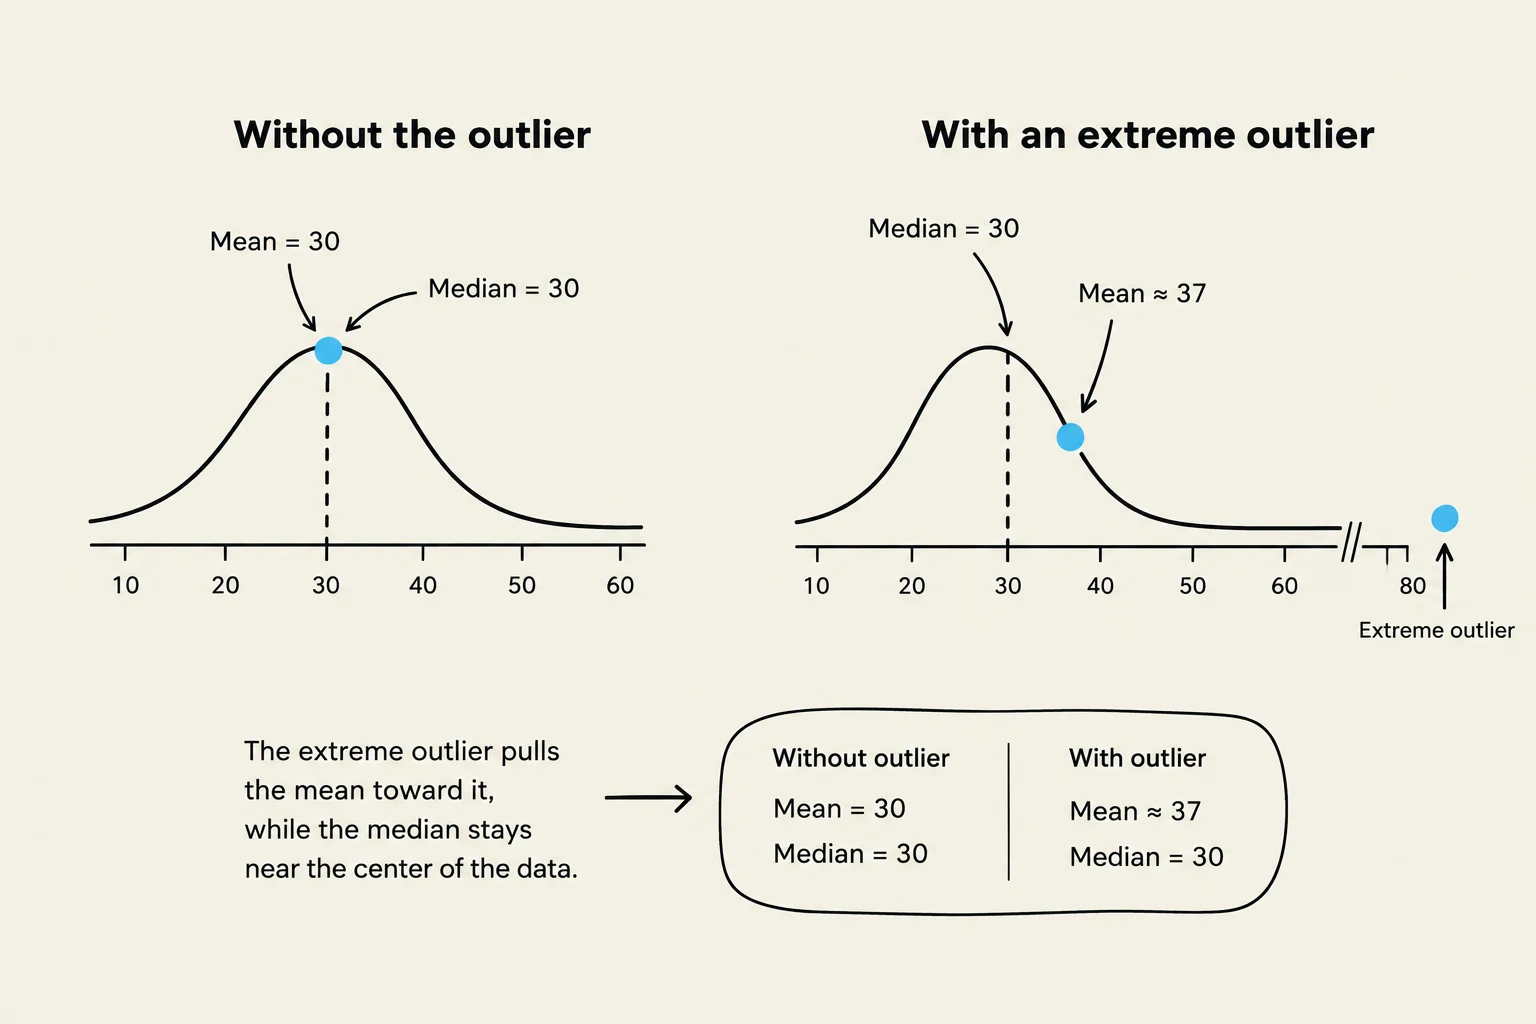
When analyzing a dataset, we often want to find a single value that represents the "typical" behavior of the entire group. These values are known as measures of central tendency. While the mean (the average) is common, the mode and the median offer unique insights, especially when dealing with different types of data or when the data contains unusual extremes.
The Mode: Finding the Most Frequent Value
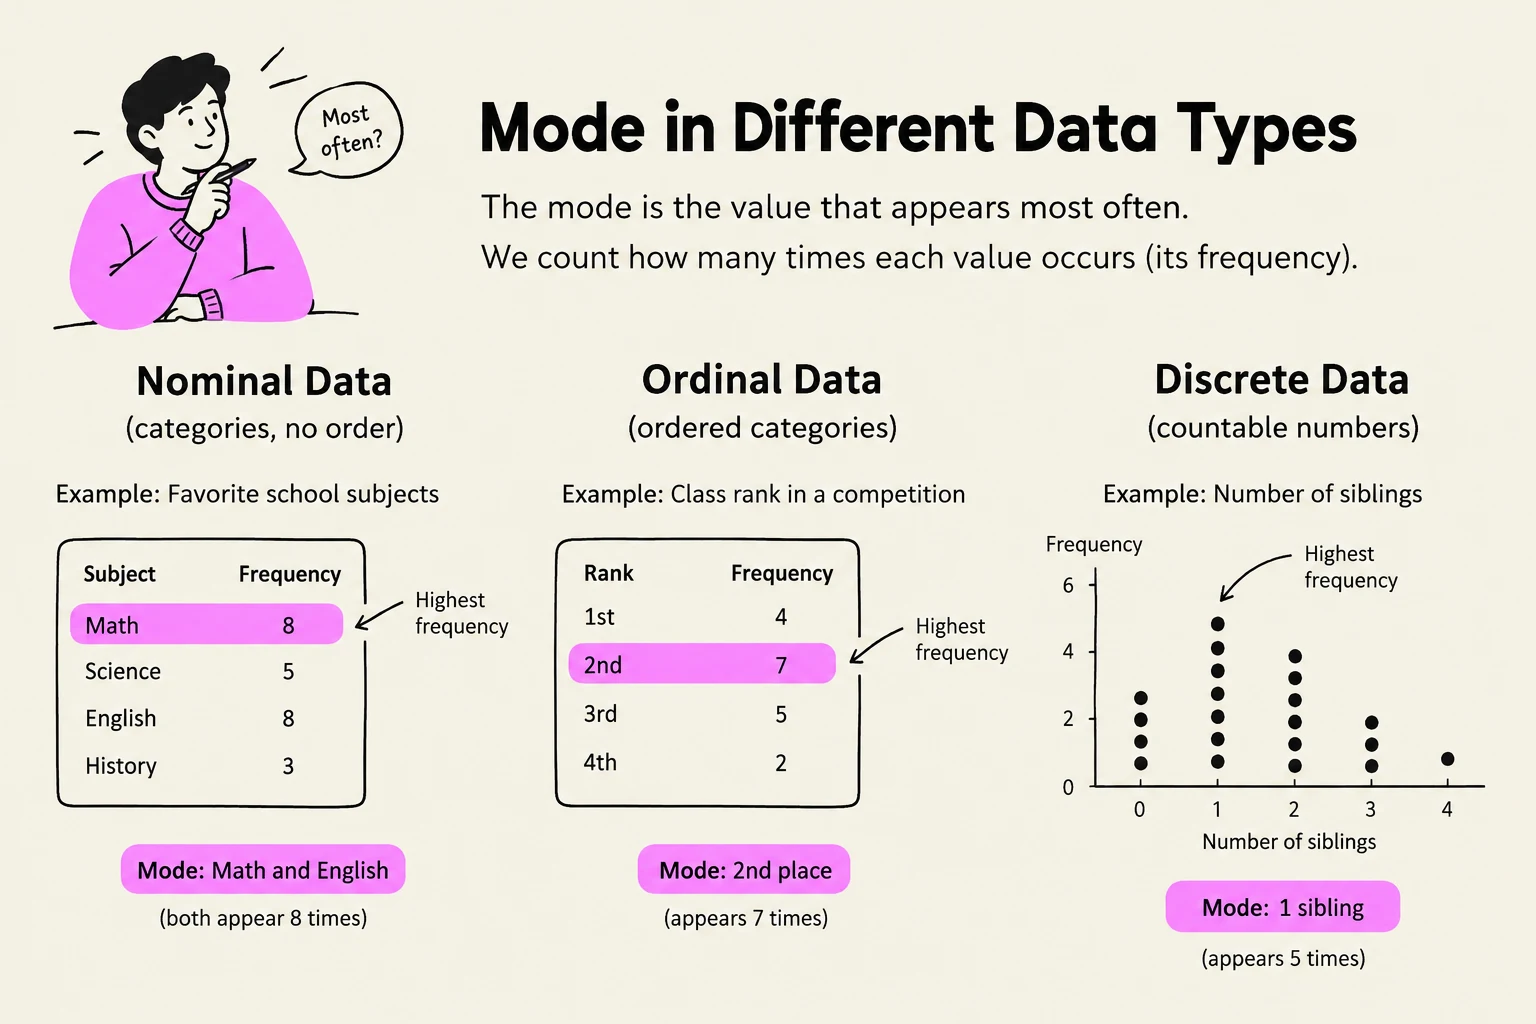
The mode is defined as the most frequent value in a column or series of data. Depending on the type of data you are analyzing, the mode behaves differently:
- Nominal Data: This is categorical data with no inherent order (e.g., favorite board games or colors). The mode is simply the category that appears most often.
- Ordinal Data: This is categorical data with a logical order (e.g., pain levels from 0 to 10). Here, we can identify which specific level occurs most frequently.
- Discrete Data: This involves distinct, countable values (e.g., points scored in a game). In some cases, you might even encounter "two modes" if two different values tie for the highest frequency.
Note on Data Cleaning: In computational tools like Python, if you try to find the mode of a column filled with empty cells, you may receive a
nan(Not a Number) result. To find a meaningful mode, you often need to use functions like.dropna(subset=['ColumnName'])to remove empty rows before calculating.

Keep reading for free.
Create an account to finish this reading and make it part of your study routine.
Continue reading freeAlready have an account? Log in
Updated