This article explains micromorts as a unit of risk for sudden death, discusses how mortality causes change with age, and contrasts life expectancy with health-adjusted life expectancy.
How do we quantify the danger of a single activity? While we often think of risk in terms of "high" or "low," these terms are subjective and difficult to compare across different scenarios. To move from intuition to science, researchers and decision scientists use specific units of measurement to standardize how we perceive the chance of death. By understanding these units, we can better grasp how mortality risks shift throughout our lives and how societal spending impacts our ability to live not just longer, but healthier lives.
The Science of Micromorts
In the field of risk estimation, comparing the danger of skydiving to the danger of driving a car can be difficult because the scales are so different. To solve this, decision scientist Ronald A. Howard introduced the concept of the micromort.
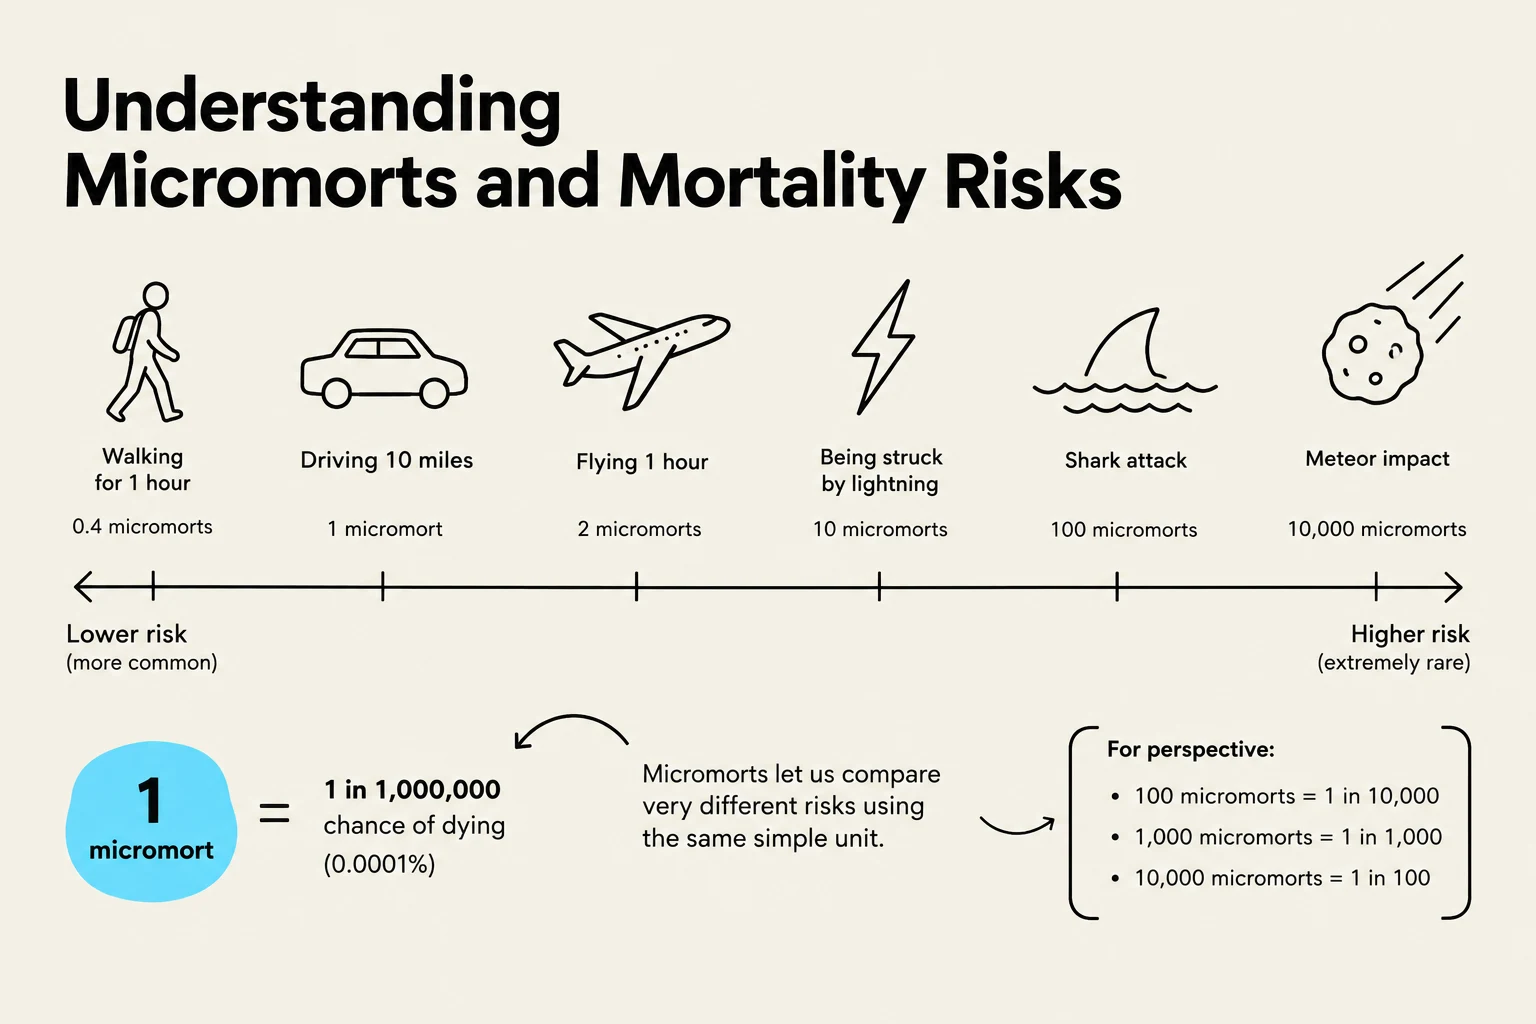
A micromort is a unit of risk equal to a one-in-a-million (1 in $1,000,000$) chance of sudden death while performing a specific activity. The name is a portmanteau of "micro" (one-millionth) and "mort" (death).
Unlike lifetime mortality, which looks at the total chance of dying over many years, a micromort is classified by specific events or habits. For example, while an exotic event like a parachute failing to open or being hit by a meteor has a very easily quantifiable risk, micromorts allow us to measure the riskiness of much more common, day-to-day situations.
Mathematical Note: To convert a probability of death into micromorts, you can use the following relationship:
Micromorts=Probability of Death×1,000,000
For example, if an activity has a $0.001%$ chance of causing death, it represents 10 micromorts.
This illustration explains micromorts, a unit of measurement for mortality risk, by comparing various activities and events to their associated risk of death.
Governments often utilize these measurements to determine where to direct financial resources to lower fatalities in specific high-risk areas.
The Shifting Landscape of Mortality
Mortality—the occurrence of death in a population—is not a static concept. The primary causes of death change significantly depending on a person's age.
The Early Years: Accidents and Suicide
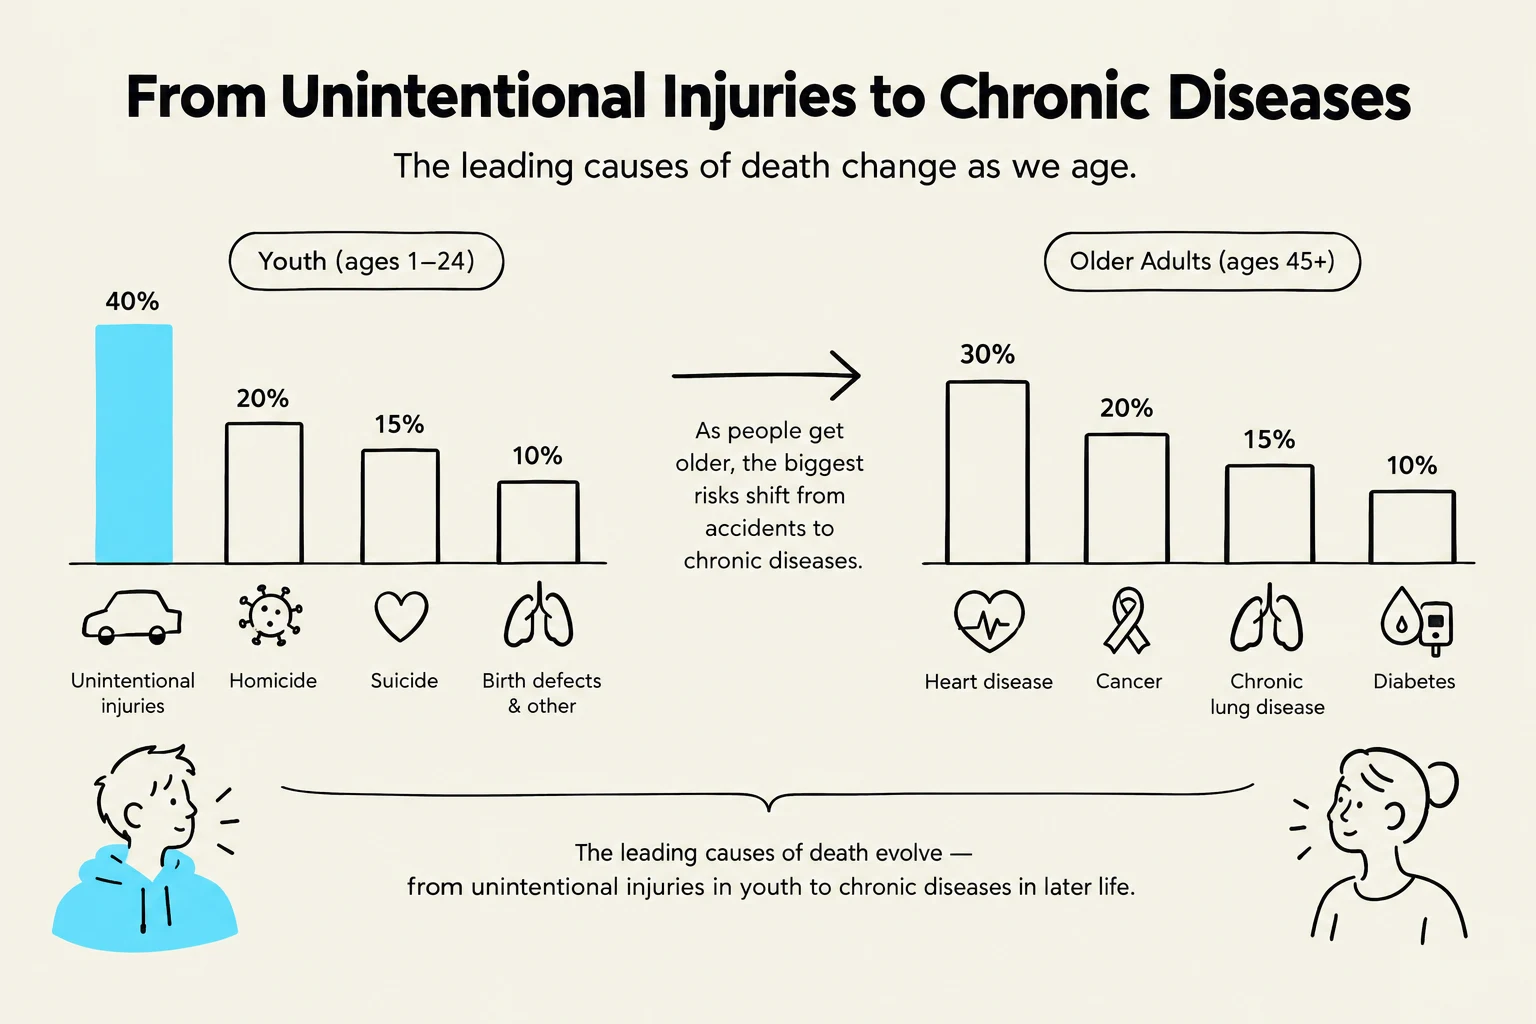
For young adults, particularly those in the 17–20 age range, the greatest risks are rarely "exotic" activities like mountaineering. Instead, this period is often characterized by "the accident and suicide years". The leading contributors to mortality in this demographic are unintentional injuries (accidents), suicide, and homicide.
The Later Years: Disease and Aging
As individuals age into the 45–64 range, the leading causes of death shift toward "the cancer and heart disease years". In North America, cancer and heart disease have historically been the primary causes of death. In recent years, COVID-19 also emerged as a significant factor in mortality statistics.
Furthermore, the baseline risk of death increases as we age; the older a person becomes, the greater their statistical risk of dying in any given period. There are also notable differences in survival based on sex. For instance, in Canada, an 80-year-old female has approximately a $60%$ chance of living to age 90, whereas an 80-year-old male has only a $48%$ chance. These variations are often influenced by physiological differences between males and females.
This infographic illustrates how the leading causes of death shift from unintentional injuries in youth to chronic diseases in older adults.
Life Expectancy vs. HALE
When discussing mortality, we often focus on Life Expectancy (LE): the average number of years a person is expected to live. In Canada, for example, the life expectancy for someone born in 2021 was approximately 82.66 years, though recent data from 2023 showed a slight dip to 81.7 years due to the pandemic.
However, living longer does not always mean living better. This introduces the concept of Health-Adjusted Life Expectancy (HALE).
Life Expectancy (LE): How much longer you are expected to live.
Healthy Life Expectancy (HALE): How much longer you can expect to live in a "healthy" state, free from significant disability or illness.
The gap between LE and HALE represents the years a person is expected to live with illness or disability. For example, if a 20-year-old has a life expectancy of 60 more years but a HALE of only 50 more years, they are expected to spend 10 years living with some form of health impairment.
Economics of Health and Public Policy
As societies age, they spend more to extend life. In Canada, healthcare is a massive public expenditure, often funded through the Canada Health Act, which ensures residents have access to medically necessary services on a prepaid basis.
The cost of maintaining health is substantial. In Canada, healthcare spending is estimated at roughly 8–11% of the Gross Domestic Product (GDP). To put this in perspective, if we use a projected 2025 Canadian GDP of $2.98 trillion, an $11%$ expenditure would equal approximately $327.8 billion, or roughly $$7,900$ per person.
Critical Thinking Challenge: If healthcare spending continues to rise as a percentage of GDP, what might be compromised? Governments must balance the desire to extend life with the need to fund other essential services like education or infrastructure.
While increasing funding can help, experts suggest that more money does not always equal more healthy years. Much of our health is determined by lifestyle choices, social factors, and preventative measures rather than just medical intervention. Therefore, many argue that more funding should be directed toward prevention—helping people avoid hospital visits in the first place—rather than just treating illness after it occurs.
Keep reading for free.
Create an account to finish this reading and make it part of your study routine.