


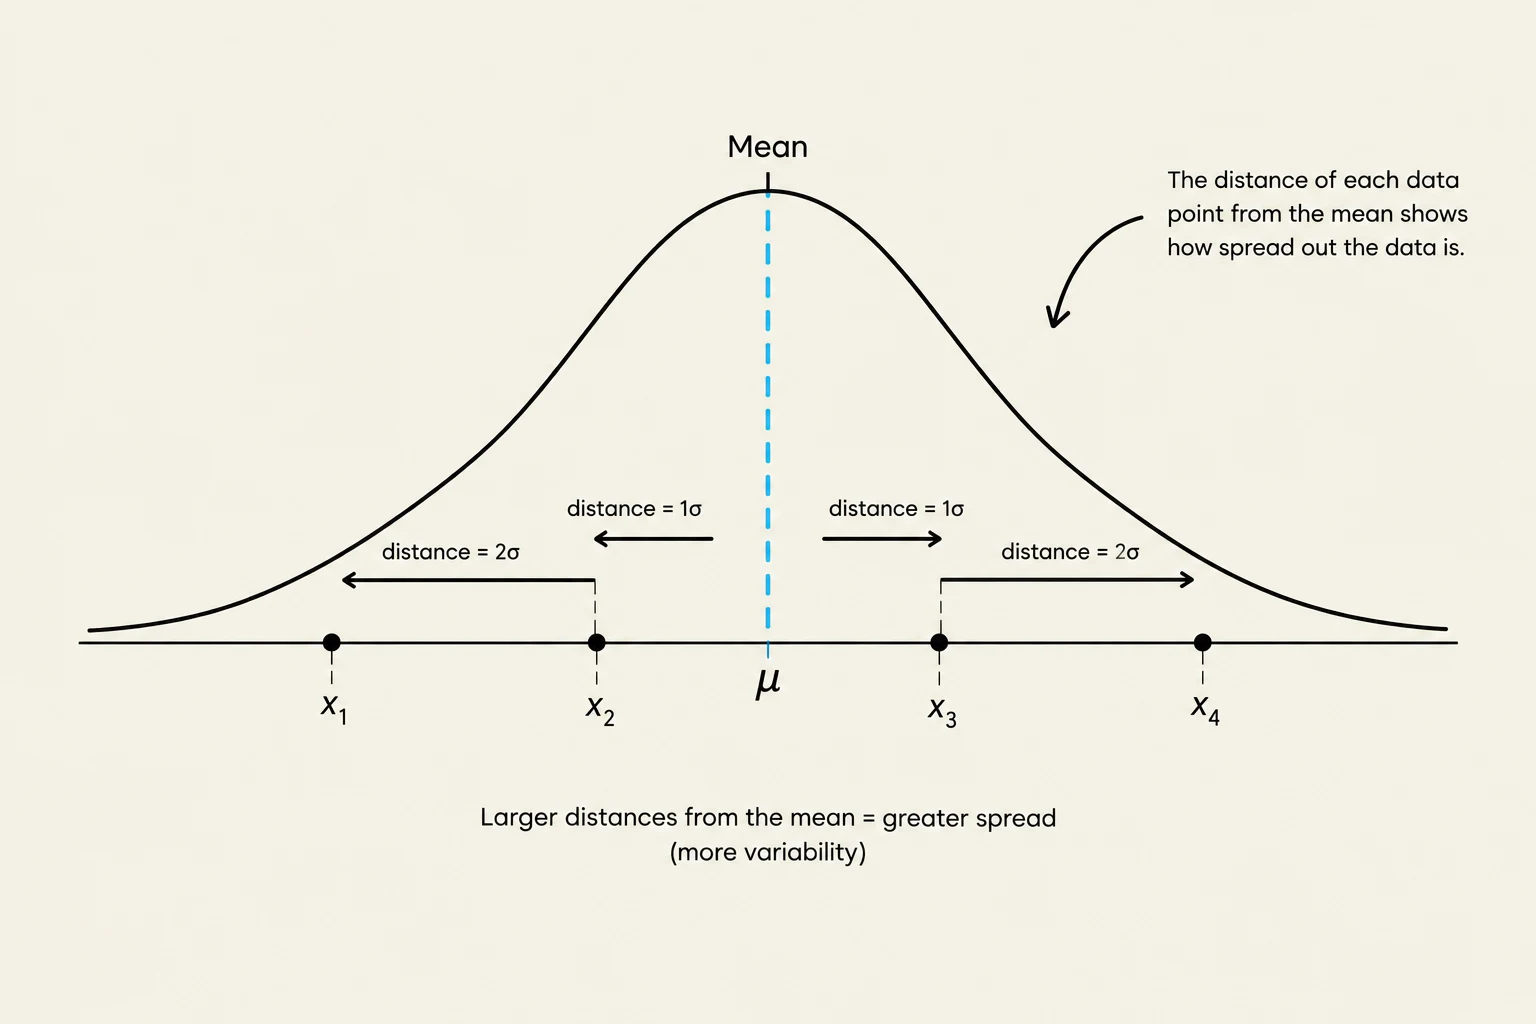
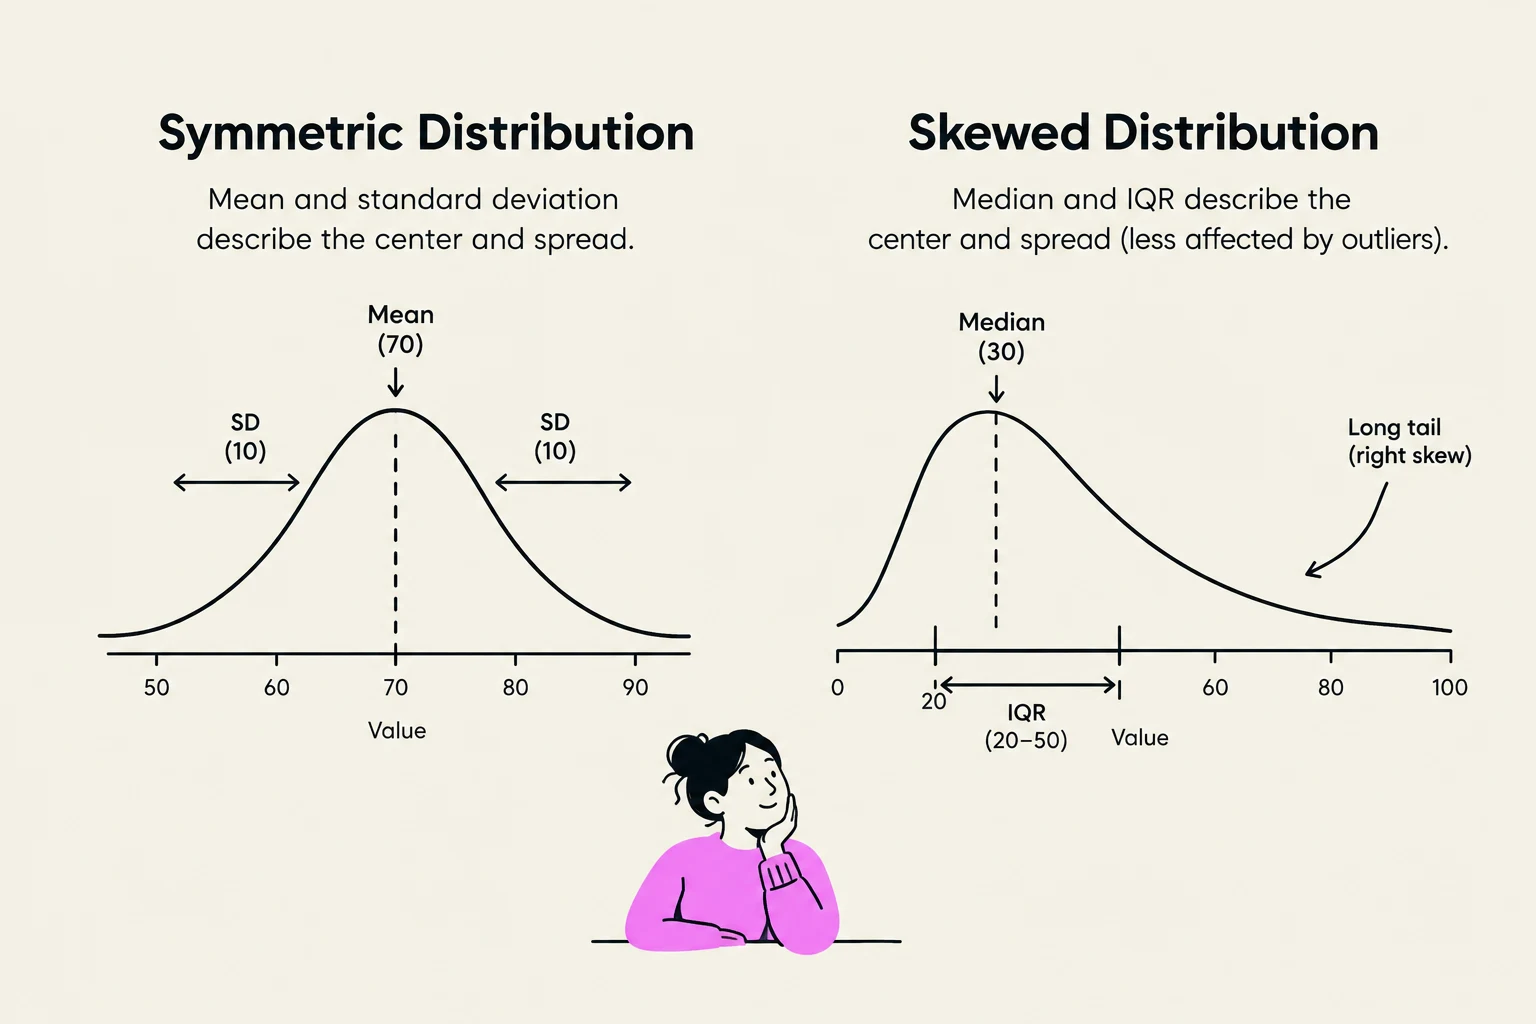
When we analyze a dataset, knowing the "center" (the average or middle value) is only half the story. To truly understand our data, we must also understand its variability—how much the individual observations differ from that center. This concept is known as the spread. Whether you are looking at human heights, test scores, or financial profits, understanding the spread helps you determine if your data points are tightly clustered or widely scattered.
Measures of Spread
Spread quantifies the amount of deviation in a dataset. Depending on the nature of your data and the presence of outliers, different mathematical tools are used to measure this variability.
Variance and Standard Deviation
The most common way to measure spread for quantitative data is through variance and standard deviation.
Sample Variance () represents the "average" of the squared deviations from the sample mean (). Because we are working with a sample rather than an entire population, we divide by rather than to provide an unbiased estimate. The formula is:
Sample Standard Deviation () is the square root of the variance:
While variance is mathematically useful, it is expressed in "units squared" (e.g., ), which can be difficult to interpret. Therefore, the standard deviation is considered the only "proper" measure of spread because it returns to the original units of the data (e.g., ), representing the typical distance an observation lies from the mean.
Keep reading for free.
Create an account to finish this reading and make it part of your study routine.
Continue reading freeAlready have an account? Log in
Updated