Understanding Market Equilibrium: Supply and Demand Dynamics
This content explains the fundamental economic concepts of demand and supply, their respective laws, and how they interact to determine market equilibrium. It details the concepts of surpluses and shortages, and provides a step-by-step guide to analyzing shifts in market equilibrium due to external factors, illustrated
In any economy, a fundamental question arises: how are resources allocated and how are prices determined? While some economies rely on central planners to make these decisions, most modern economies are "market economies" or decentralized economies. In these systems, economic decisions are driven by the individual choices of millions of consumers and producers. To understand how these individual decisions coalesce into a functioning society, we must study the interaction between two primary forces: demand and supply.
The Building Blocks: Demand and Supply
At the heart of every market is the concept of demand. Demand refers to the desire, ability, and willingness of consumers to purchase a good or service at various prices. When we talk about demand, we often distinguish between individual demand (the behavior of a single person) and market demand (the sum of all individual demands in a specific market).
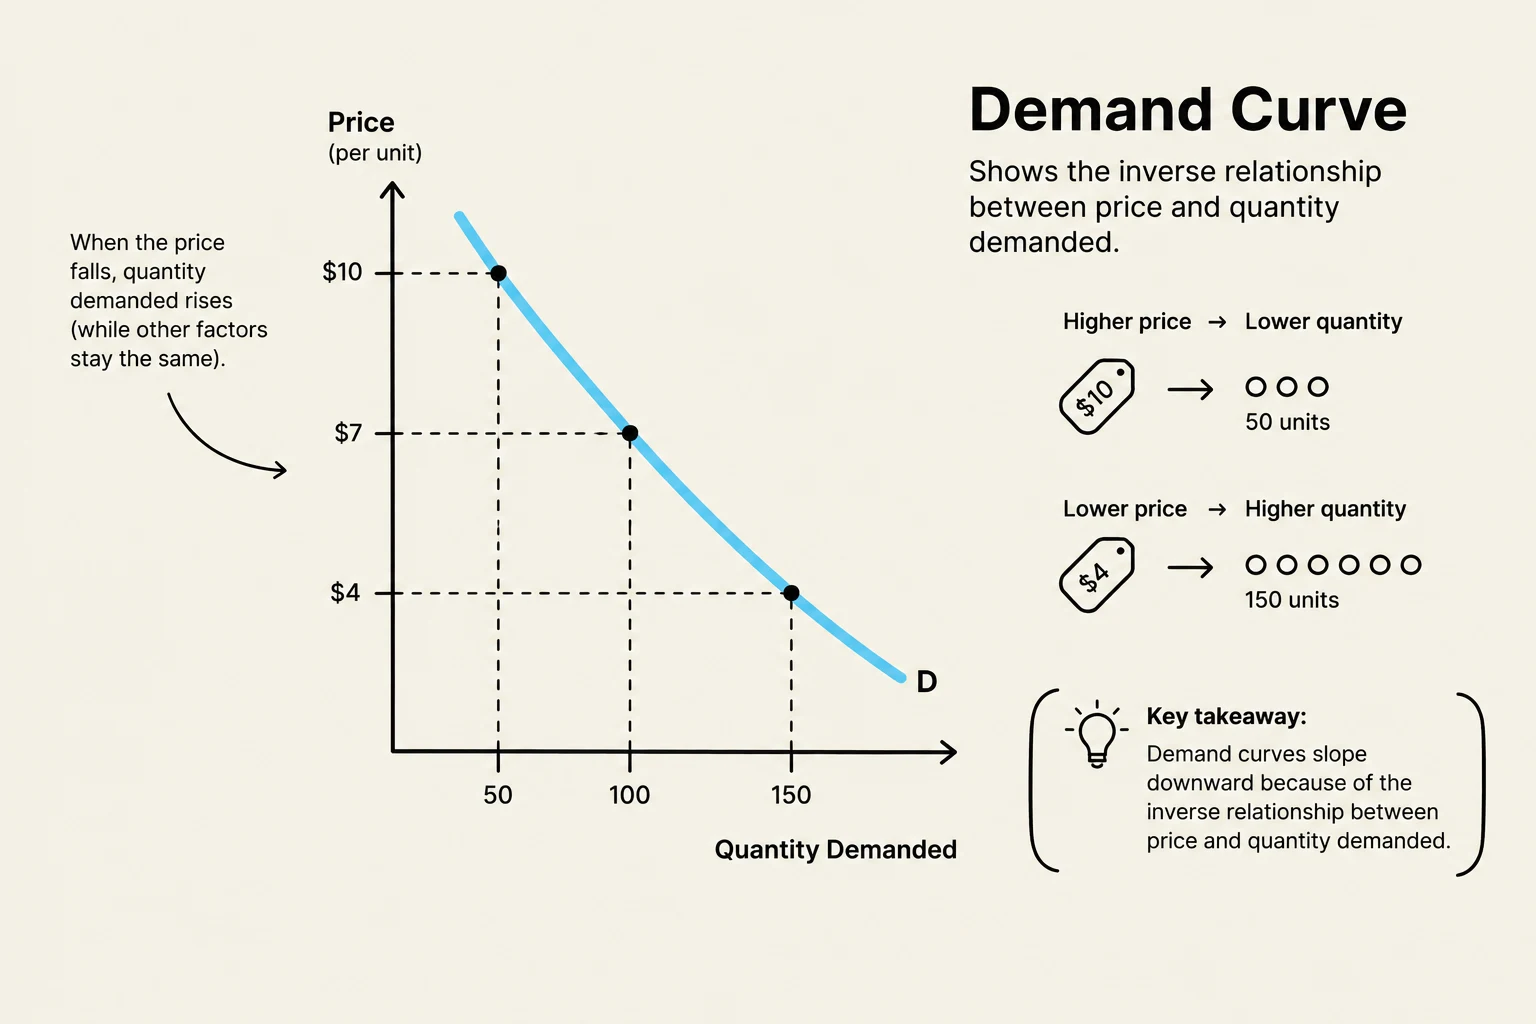
The relationship between price and quantity demanded is governed by the Law of Demand. This law states that, all else being equal, as the price of a good increases, the quantity demanded decreases; conversely, as the price decreases, the quantity demanded increases.
A demand curve illustrates the inverse relationship between the price of a product and the quantity demanded. As the price decreases, the quantity demanded increases, and vice versa, assuming other factors remain constant.
On the other side of the market is supply. Supply represents the amount of a good or service that producers are willing and able to offer for sale at various prices. Just as with demand, we distinguish between individual supply and market supply.
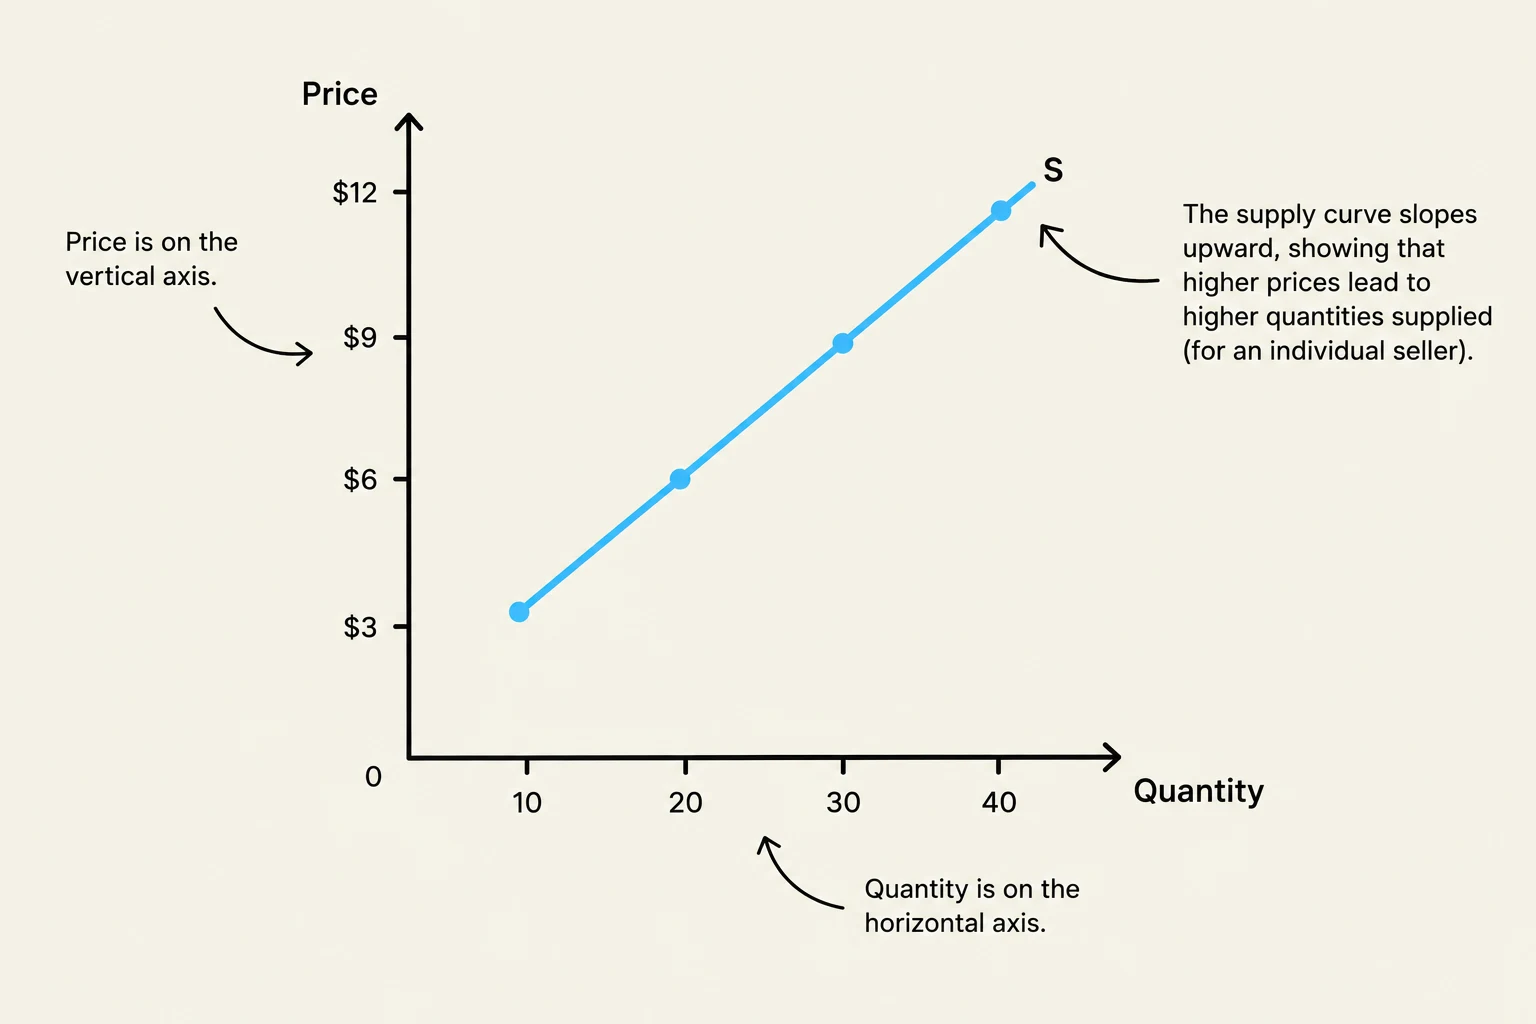
The Law of Supply dictates the behavior of producers: as the price of a good increases, the quantity supplied also increases, because higher prices offer greater profit incentives. This creates an upward-sloping relationship between price and quantity.
A supply curve graph illustrating the relationship between price and quantity supplied, where the price is on the vertical axis and quantity is on the horizontal axis. The upward slope indicates that higher prices lead to higher quantities supplied.
Study Tip: Remember the difference between a "movement along" a curve and a "shift" of a curve. A change in the price of the good itself causes a movement along the existing demand or supply curve. A change in an outside factor (like consumer tastes or production costs) causes the entire curve to shift.
Reaching Market Equilibrium
When the forces of demand and supply meet, they can reach a state of balance known as market equilibrium. Equilibrium occurs at the specific price where the quantity that consumers want to buy exactly equals the quantity that producers want to sell.
This state of balance is defined by two distinct components:
Equilibrium Price: The unique price at which the market clears.
Equilibrium Quantity: The specific amount of the good bought and sold at the equilibrium price.
At this point, there is no inherent tendency for the price or quantity to change because the market is "in balance".
The Invisible Hand
This model illustrates Adam Smith’s famous concept of the "invisible hand". The theory suggests that even if a market is not initially in equilibrium, the natural forces of competition and price adjustments will drive the market back toward that balance point.
Imbalances: Surpluses and Shortages
Markets are not always in equilibrium. When the prevailing market price deviates from the equilibrium price, imbalances occur.
Excess Supply (Surplus)
If the market price is set above the equilibrium price, producers want to sell more than consumers want to buy. This situation is known as excess supply, or more commonly, a surplus. In a surplus, sellers will typically lower their prices to clear out their excess inventory, which eventually pushes the price back down toward equilibrium.
Excess Demand (Shortage)
If the market price is below the equilibrium price, consumers want to buy more than producers are willing to supply. This is known as excess demand, or a shortage. During a shortage, consumers may compete for the limited goods, bidding the price up, which eventually pushes the price back toward equilibrium.
Analyzing Market Shifts: A Step-by-Step Guide
In the real world, markets are constantly changing due to external events. To predict how an event will change the equilibrium price and quantity, you should follow a three-step analytical process:
Identify the impact: Does the event affect demand, supply, or both?
Determine the direction: Does the event cause demand or supply to increase or decrease?
Predict the outcome: How does that specific change impact the equilibrium price and quantity?
Worked Example 1: The Heat Wave
Imagine a sudden, intense heat wave hits a region. What happens to the ice-cream market?
Step 1 (Demand or Supply?): A heat wave changes consumer preferences; people want more ice cream to stay cool. This affects demand.
Step 2 (Direction?): Because people want more ice cream at every price point, demand increases.
Step 3 (Equilibrium change?): An increase in demand will drive both the equilibrium price and the equilibrium quantity upward.
Worked Example 2: Rising Input Costs
Now, consider a different scenario: the price of sugar increases. Sugar is a key ingredient in ice cream.
Step 1 (Demand or Supply?): Since sugar is an input for production, this affects the cost of making ice cream, which impacts supply.
Step 2 (Direction?): Higher production costs make it less profitable to produce ice cream, so supply decreases.
Step 3 (Equilibrium change?): A decrease in supply will cause the equilibrium price to increase and the equilibrium quantity to decrease.
Complex Scenarios: Simultaneous Shifts
Sometimes, multiple events happen at once. For instance, what if a heat wave occurs (increasing demand) at the same time the price of sugar rises (decreasing supply)?.
In this case, both curves shift simultaneously. The equilibrium price will definitely increase because both a demand increase and a supply decrease push prices up. However, the effect on the equilibrium quantity is ambiguous—it depends on whether the increase in demand is larger or smaller than the decrease in supply.
Exam Tip: When both curves shift, always solve for the price and quantity changes separately. If both shifts push price in the same direction, the price change is certain. If they push quantity in opposite directions, the final change in quantity depends on the magnitude of the shifts.
Keep reading for free.
Create an account to finish this reading and make it part of your study routine.