


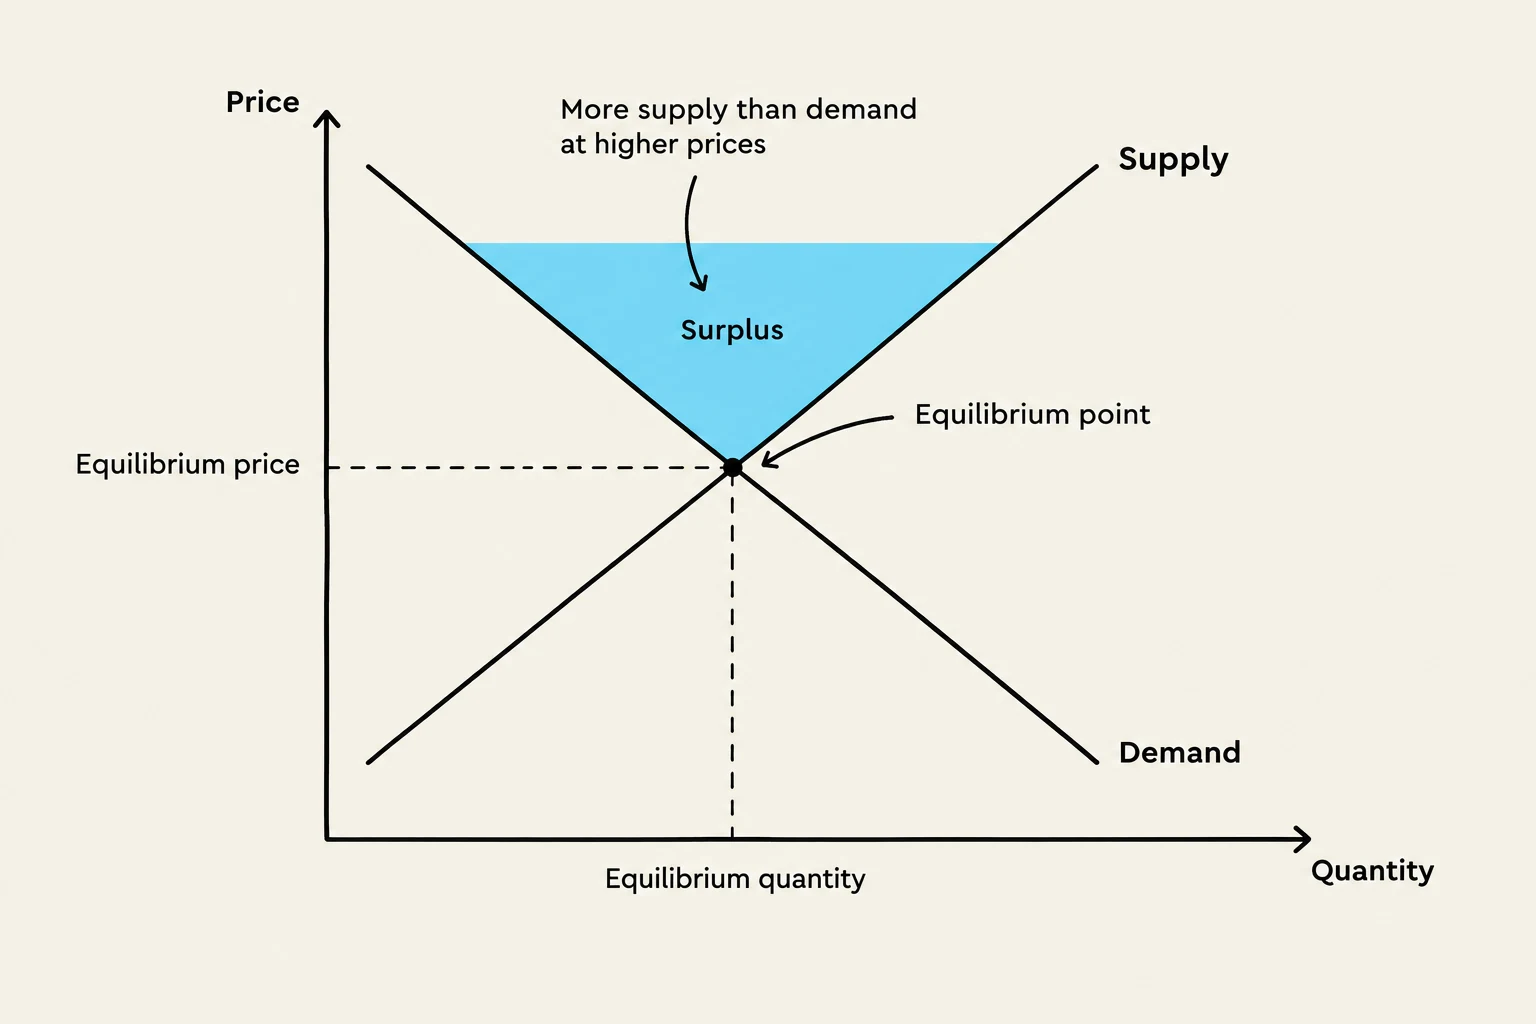
In economics, the "market" is not just a physical location, but a mechanism where buyers and sellers interact to determine prices and quantities. Understanding how these two forces—demand and supply—interact is fundamental to grasping how economies function. This article will guide you through the mathematical and visual tools used to identify market equilibrium, including functions, schedules, and curves.
The Building Blocks: Demand and Supply
To analyze a market, we must first understand the behavior of consumers and producers separately.
Demand: The Consumer Perspective
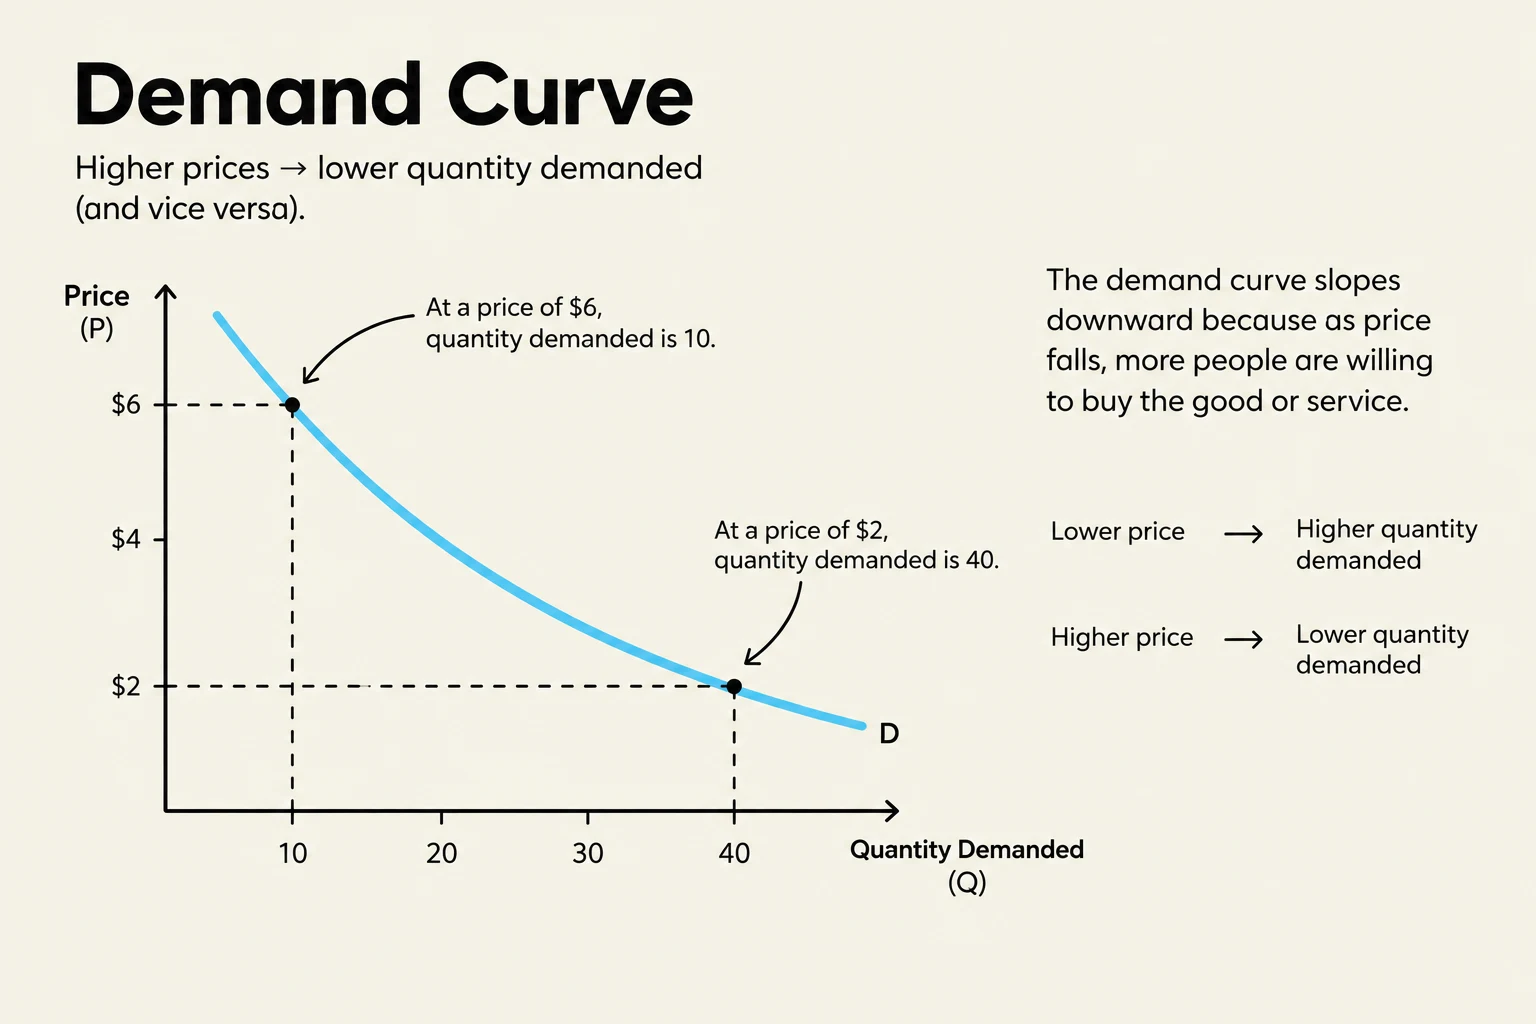
The demand function is a mathematical equation that expresses the relationship between the price of a good and the quantity consumers are willing to buy. For example, a demand function might look like this: $Q_D = 4,500 - 10P$ where is the quantity demanded and is the price.
When we take specific prices and plug them into this function, we create a demand schedule—a table showing the quantity demanded at various price points. When these points are plotted on a graph, they form the demand curve, which typically slopes downward, reflecting that as prices rise, consumers buy less.
Supply: The Producer Perspective
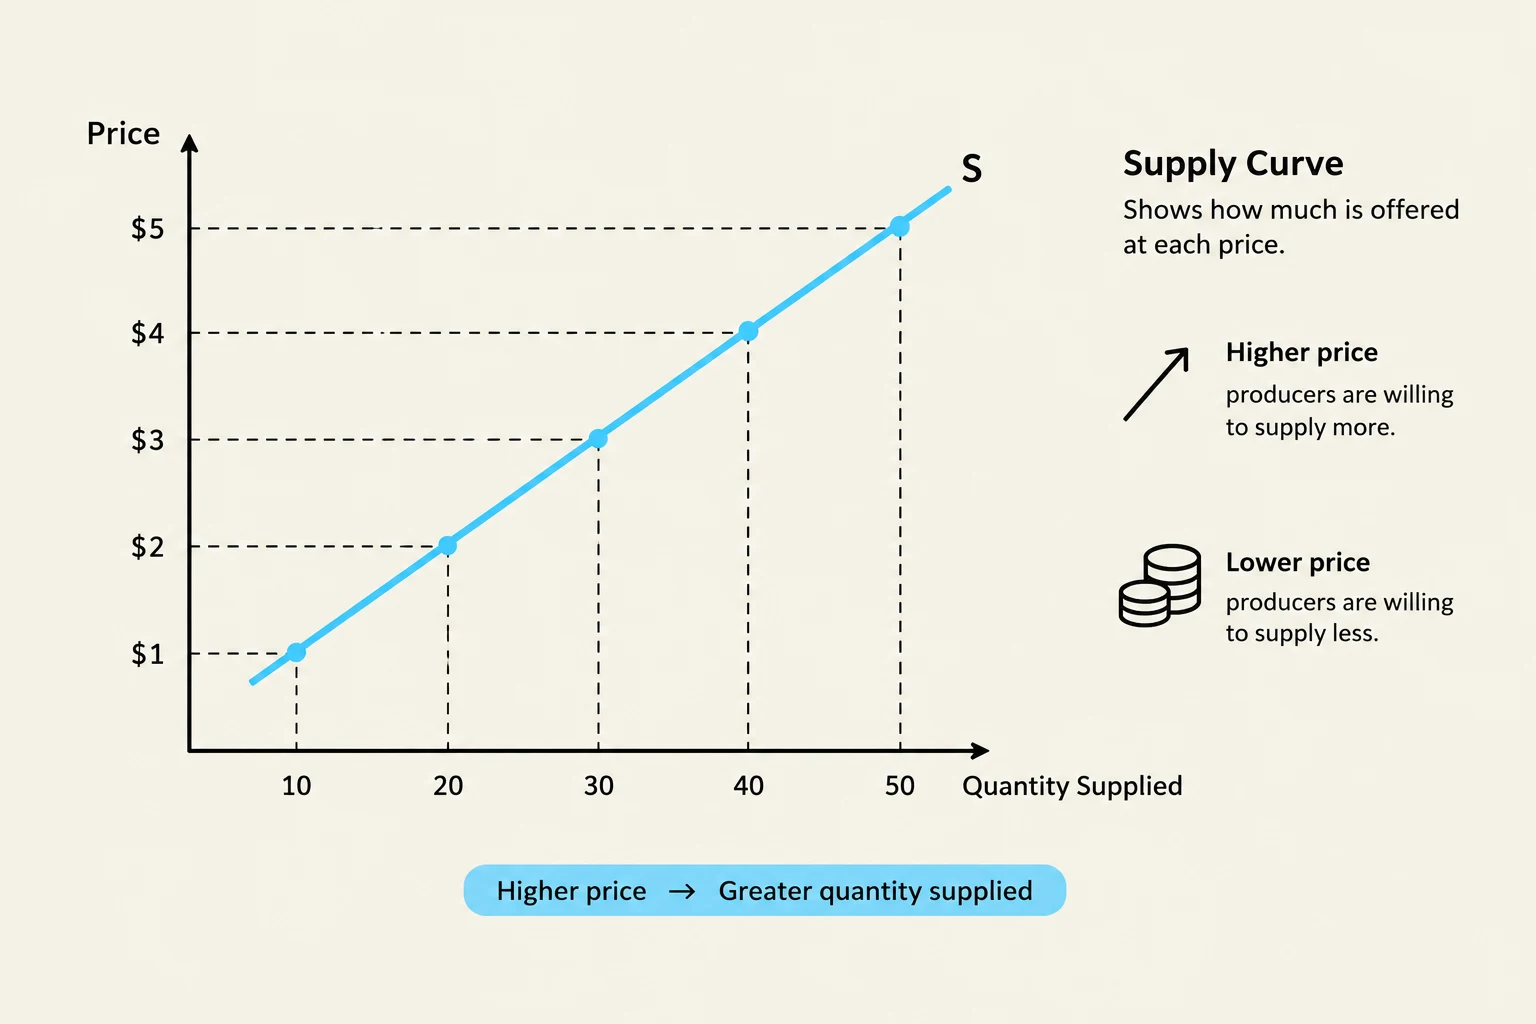
On the other side of the market is the producer. The supply function represents how much of a good sellers are willing to provide at different prices. Using the same logic as demand, a supply schedule is a table of quantities supplied at specific prices, and the supply curve is its graphical representation. Unlike demand, the supply curve typically slopes upward, as higher prices incentivize producers to supply more.
Keep reading for free.
Create an account to finish this reading and make it part of your study routine.
Continue reading freeAlready have an account? Log in
Updated