Understanding Market Dynamics: Demand, Supply, and Equilibrium
This lecture explores the fundamental economic concepts of consumer demand, producer supply, and market equilibrium. It explains how these forces interact to determine prices and quantities in a market, and how various factors can shift these outcomes.
Economics provides a powerful framework for understanding how markets function, and at its core lies the interplay between consumer demand and producer supply. This lecture explores how consumers make decisions about what to buy, how these decisions shape the overall demand for a product, and how this interacts with the supply side to determine the price and quantity of goods exchanged in a market. We will build a simple model to illustrate these fundamental concepts, focusing on how changes in various factors can shift market outcomes.
The Demand Function: Consumer Choices
At the heart of understanding consumer behavior is the demand function. This function describes the relationship between the price of a product and the quantity demanded by consumers, assuming all other factors remain constant. In simpler terms, it tells us how much of a good or service people are willing and able to buy at various prices. Generally, we observe an inverse relationship: as the price of a product increases, the quantity demanded tends to decrease, and vice versa. This is often referred to as the Law of Demand.
The demand function can be represented graphically as a demand curve. This curve typically slopes downwards, illustrating the negative relationship between price and quantity demanded. The variables we are measuring are the product's price on one axis and the quantity demanded on the other.
This graph illustrates the law of demand, showing the inverse relationship between the price of a good and the quantity demanded. As the price decreases from P1 to P2, the quantity demanded increases from Q1 to Q2.
Shifts in Demand and Supply
While the demand curve shows how quantity demanded changes with price, it's crucial to understand that other factors can cause the entire demand curve to shift. These are known as shifts in demand. For example, changes in consumer income, the prices of related goods (substitutes and complements), consumer tastes and preferences, or expectations about future prices can all lead to a shift in the demand curve. An increase in demand shifts the curve to the right, meaning consumers are willing to buy more at every price. A decrease in demand shifts the curve to the left.
Similarly, the supply curve represents the relationship between the price of a product and the quantity supplied by producers. It typically slopes upwards, indicating that producers are willing to supply more of a good at higher prices. Shifts in supply occur when factors other than the product's own price change, such as the cost of inputs, technology, government policies, or the number of sellers in the market. An increase in supply shifts the curve to the right, while a decrease shifts it to the left.
Exam Tip: Be careful to distinguish between a "movement along the demand curve" (which occurs due to a change in the product's own price) and a "shift in the demand curve" (which occurs due to a change in other factors affecting demand). The same distinction applies to supply.
Market Equilibrium: Where Supply Meets Demand
The concept of market balance, or market equilibrium, is where the forces of supply and demand meet. The equilibrium price is the specific price at which the quantity of a product demanded by consumers exactly equals the quantity supplied by producers. At this price, the market "clears," meaning there is no surplus or shortage of the good.
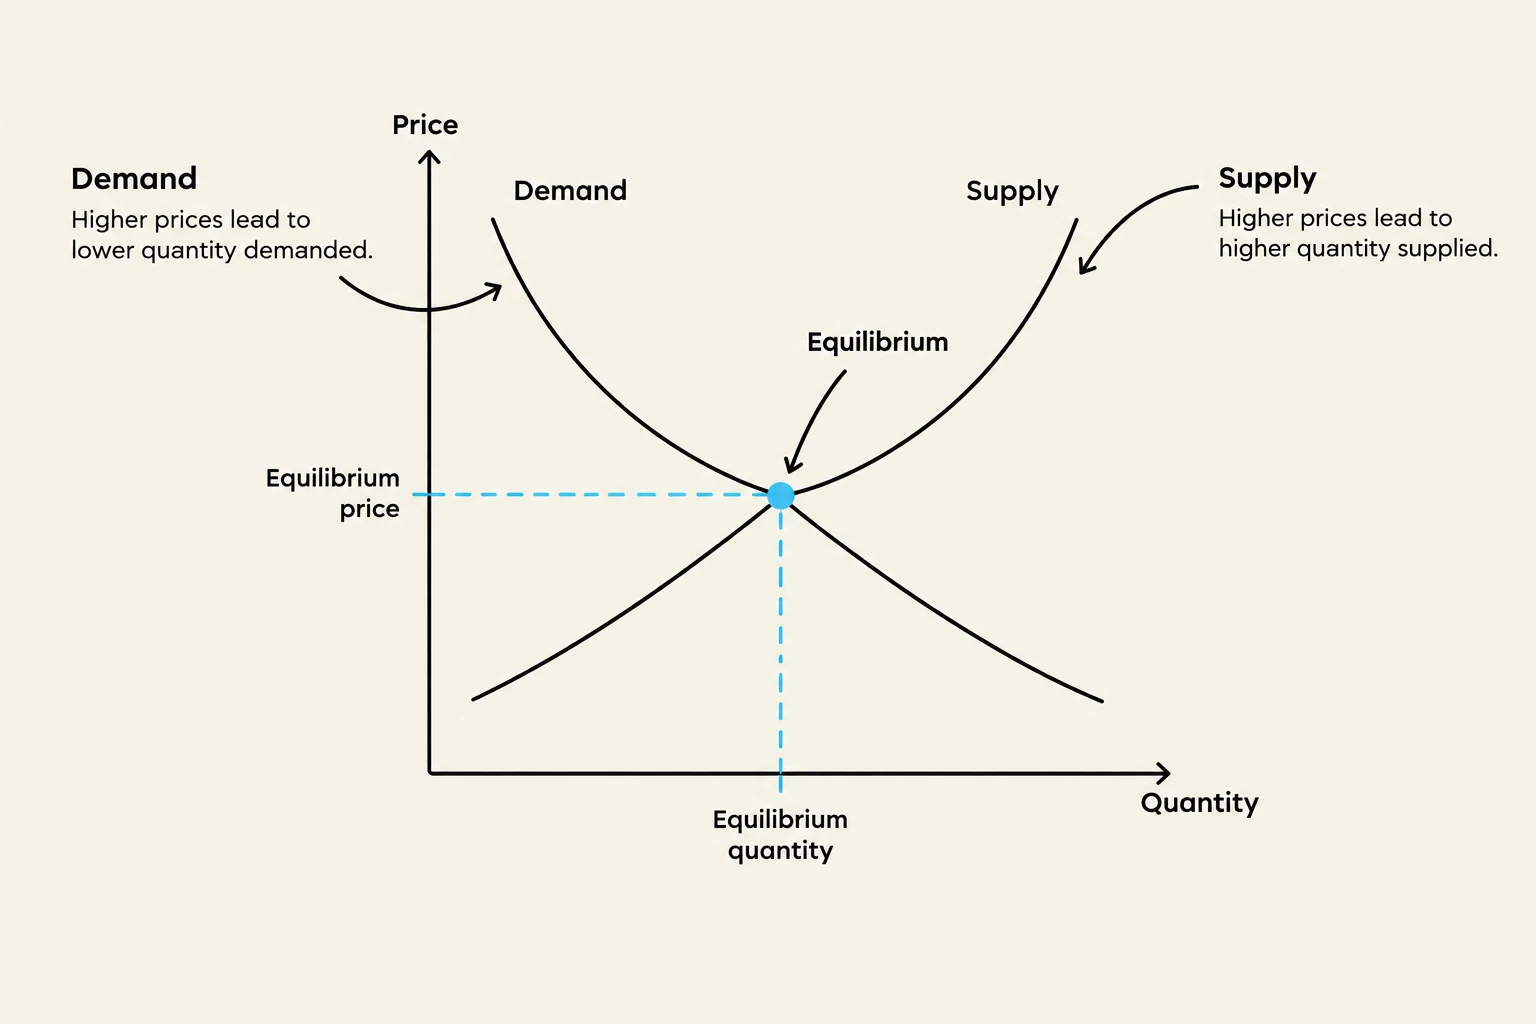
Graphically, market equilibrium occurs at the intersection of the supply and demand curves. This intersection point determines both the equilibrium price and the equilibrium quantity – the amount of the good that will be bought and sold at that price.
This graph illustrates the economic principles of supply and demand, showing how the equilibrium price and quantity are determined at the intersection of the supply and demand curves.
When market conditions change, leading to shifts in either the supply or demand curve, the equilibrium price and quantity will also change. For instance, if demand for a product increases (demand curve shifts right), and supply remains constant, both the equilibrium price and the equilibrium quantity will rise. Conversely, if supply decreases (supply curve shifts left) while demand is unchanged, the equilibrium price will increase, but the equilibrium quantity will decrease.
Price and Quantity Interactions
The dynamic interaction between price and quantity is fundamental to how markets adjust. When a market is not at equilibrium, forces naturally push it towards balance. If the price is above the equilibrium price, the quantity supplied will exceed the quantity demanded, leading to a surplus. Producers will then likely lower their prices to sell off excess inventory, moving the market back towards equilibrium. If the price is below the equilibrium price, the quantity demanded will exceed the quantity supplied, creating a shortage. In this situation, consumers may bid up prices, or producers will see an opportunity to raise prices, again guiding the market toward equilibrium.
Worked Example: Imagine the market for coffee. Suppose a new study reveals significant health benefits of coffee, leading to increased consumer desire. This would cause a rightward shift in the demand curve for coffee. If the supply of coffee remains unchanged, the equilibrium price of coffee will rise, and the quantity of coffee bought and sold will also increase.
Consider another scenario: if a severe frost damages coffee crops in a major producing region, this would reduce the supply of coffee. This would cause a leftward shift in the supply curve. If consumer demand for coffee stays the same, the equilibrium price of coffee will increase, and the equilibrium quantity traded will decrease.
Understanding these concepts of demand, supply, and equilibrium is crucial for analyzing how markets respond to various economic events and policy changes. By modeling these relationships, economists can predict how changes in price and quantity will affect consumers and producers.
Keep reading for free.
Create an account to finish this reading and make it part of your study routine.