Understanding Lipid Profiles: Cholesterol and Triglycerides
This guide explains the components of a lipid profile, including LDL, HDL, and triglycerides, their roles in cardiovascular health, and how to interpret target ranges and cholesterol ratios.
When a healthcare provider orders a "lipid panel," they are looking for a snapshot of the fats (lipids) circulating in your bloodstream. These measurements are critical indicators of cardiovascular health, as abnormal levels can contribute to the development of atherosclerosis—the buildup of plaque in the arterial walls. Understanding the distinction between "good" and "bad" cholesterol, as well as the role of triglycerides, is essential for anyone studying nursing, medicine, or personal wellness.
The Components of a Lipid Profile
A standard lipid profile typically measures four distinct components: Total Cholesterol, Low-Density Lipoprotein (LDL), High-Density Lipoprotein (HDL), and Triglycerides. While we often speak of "cholesterol" as a single entity, it is actually transported through the blood by different types of lipoproteins, which determine whether the cholesterol is helpful or harmful to your arteries.
Low-Density Lipoprotein (LDL): The "Bad" Cholesterol
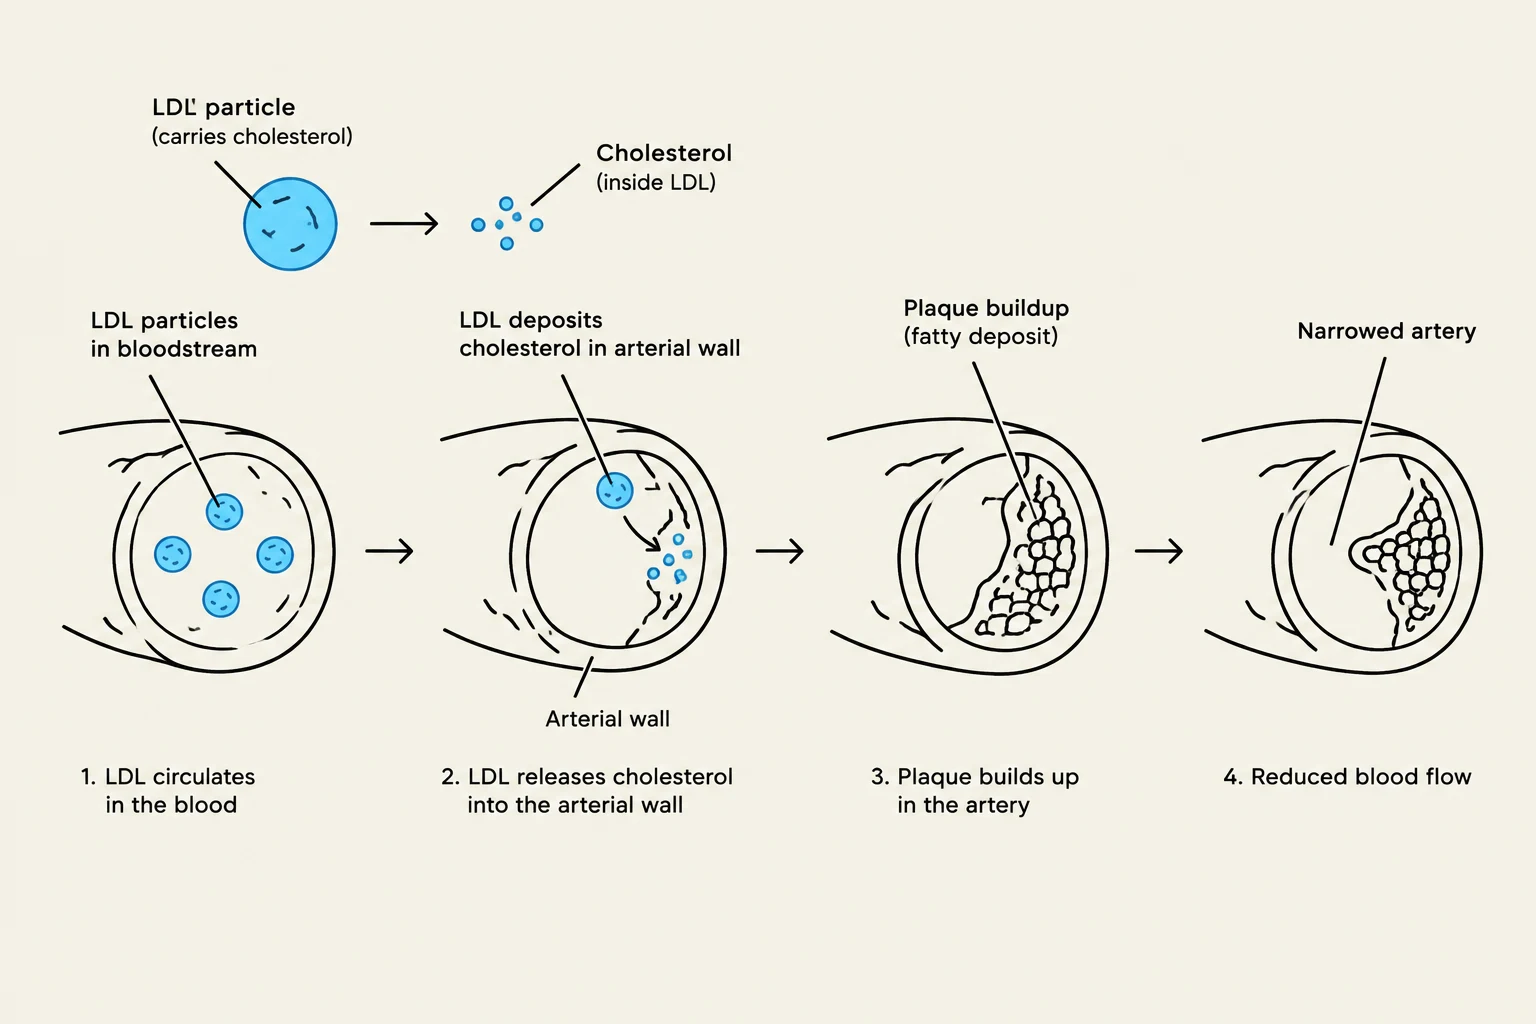
LDL is often referred to as "bad" cholesterol because its primary role is to transport cholesterol from the liver to the cells throughout the body. However, when levels are too high, LDL particles can accumulate in the walls of the arteries. This process leads to the formation of plaque, which narrows the vessels and increases the risk of heart attack and stroke.
Diagram illustrating the process of atherosclerosis, where LDL cholesterol deposits in the arterial wall, leading to plaque buildup and narrowed arteries, which reduces blood flow.
High-Density Lipoprotein (HDL): The "Good" Cholesterol
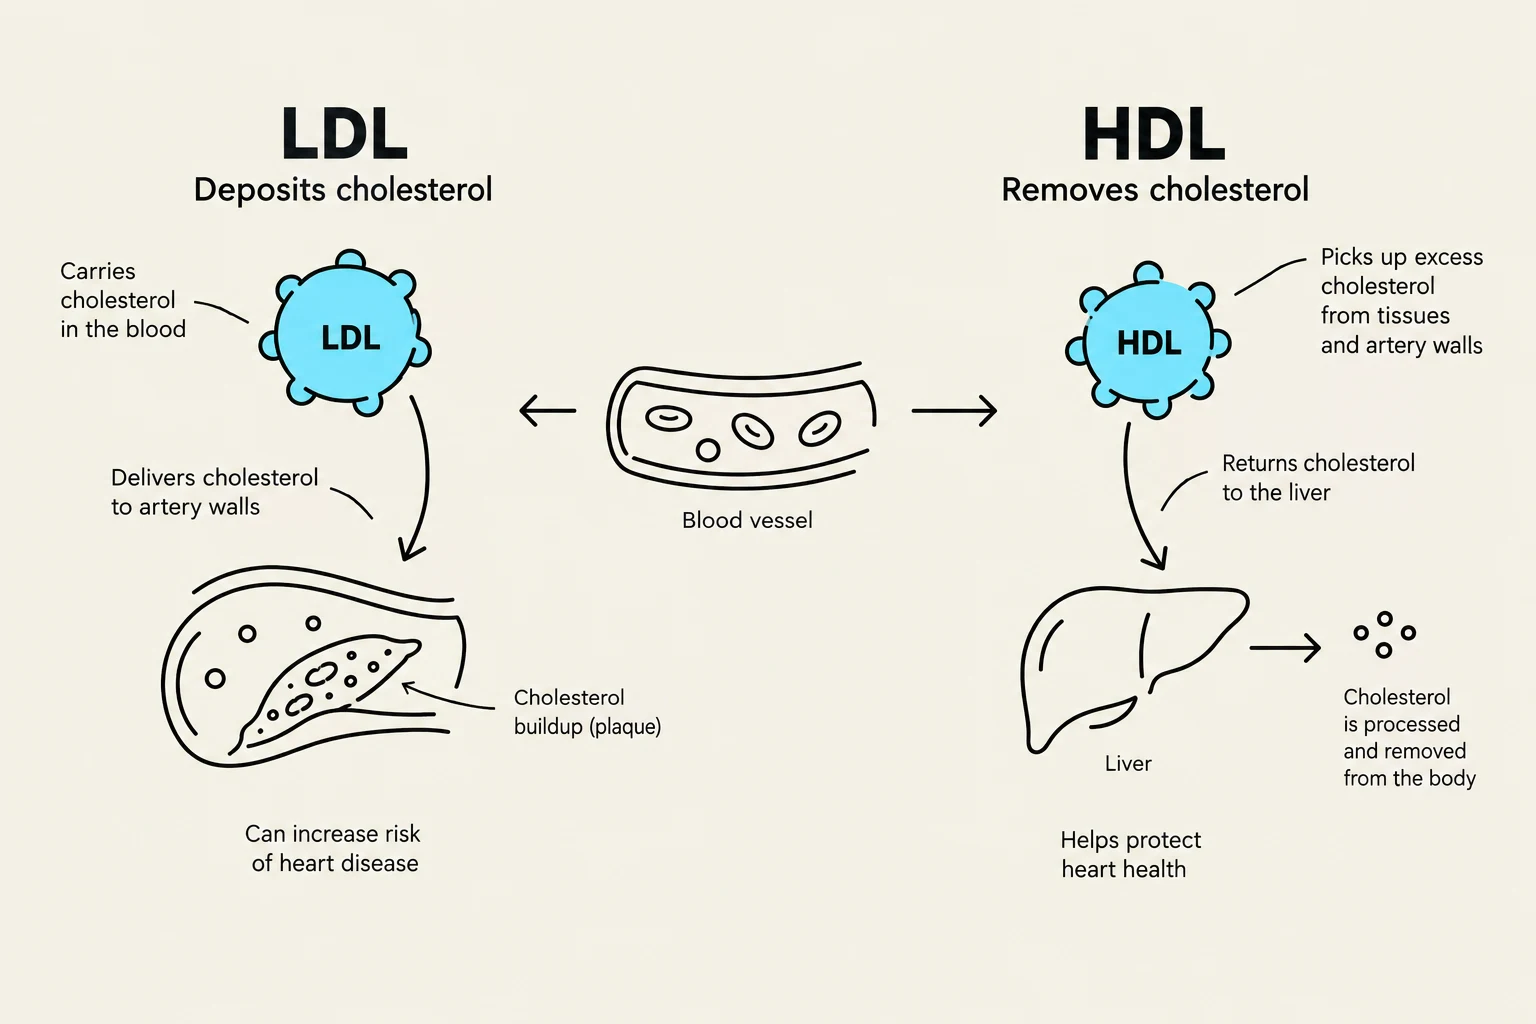
In contrast, HDL is known as "good" cholesterol. Its job is to act as a scavenger; it picks up excess cholesterol from the bloodstream and the arterial walls and transports it back to the liver, where it can be broken down and excreted from the body. Higher levels of HDL are generally associated with a lower risk of cardiovascular disease.
Triglycerides
Triglycerides are the most common type of fat in the body. They serve as a major energy source, storing excess calories from your diet for later use. While they are necessary for energy, elevated triglyceride levels—often caused by high intake of sugar, alcohol, or simple carbohydrates—are linked to an increased risk of heart disease and can contribute to the thickening of artery walls.
This diagram illustrates the distinct roles of LDL (low-density lipoprotein) and HDL (high-density lipoprotein) in cholesterol transport within the body. LDL deposits cholesterol, potentially leading to plaque buildup and increased heart disease risk, while HDL removes excess cholesterol and returns it to the liver for processing and removal, thus helping to protect heart health.
Understanding Target Ranges and Values
To assess cardiovascular risk, clinicians compare a patient's results against standardized target ranges. It is important to note that "normal" ranges can vary slightly depending on the laboratory and the patient's individual risk factors (such as age, smoking status, or existing diabetes).
The following table summarizes the general clinical targets for a healthy adult:
Component
Desirable Range
Clinical Significance
Total Cholesterol
< 200 mg/dL
Lower is generally better for heart health.
LDL Cholesterol
< 100 mg/dL
Lower levels reduce plaque formation risk.
HDL Cholesterol
> 40 mg/dL (men) / > 50 mg/dL (women)
Higher levels provide protective effects.
Triglycerides
< 150 mg/dL
High levels indicate metabolic or dietary issues.
Exam Tip: When calculating or interpreting lipid panels, remember that the relationship between these values is key. A patient might have a "normal" total cholesterol but a dangerously high LDL and a very low HDL. Always look at the individual components rather than just the total number.
Clinical Calculations: The Cholesterol Ratio
One of the most useful metrics derived from a lipid panel is the Total Cholesterol to HDL Ratio. This ratio provides a more nuanced view of cardiovascular risk than total cholesterol alone, as it accounts for the protective effect of HDL.
Imagine a patient presents with the following lab results:
Total Cholesterol: 240 mg/dL
HDL Cholesterol: 40 mg/dL
LDL Cholesterol: 160 mg/dL
Triglycerides: 180 mg/dL
Step 1: Calculate the RatioRatioRatio=40240=6.0
Step 2: Interpretation
A ratio of 6.0 is generally considered high risk (a ratio below 5.0 is preferred, and below 3.5 is ideal). Even though the patient's total cholesterol is high, the fact that their HDL is on the lower end of the spectrum means they have less "protection" against the high LDL and total cholesterol levels.
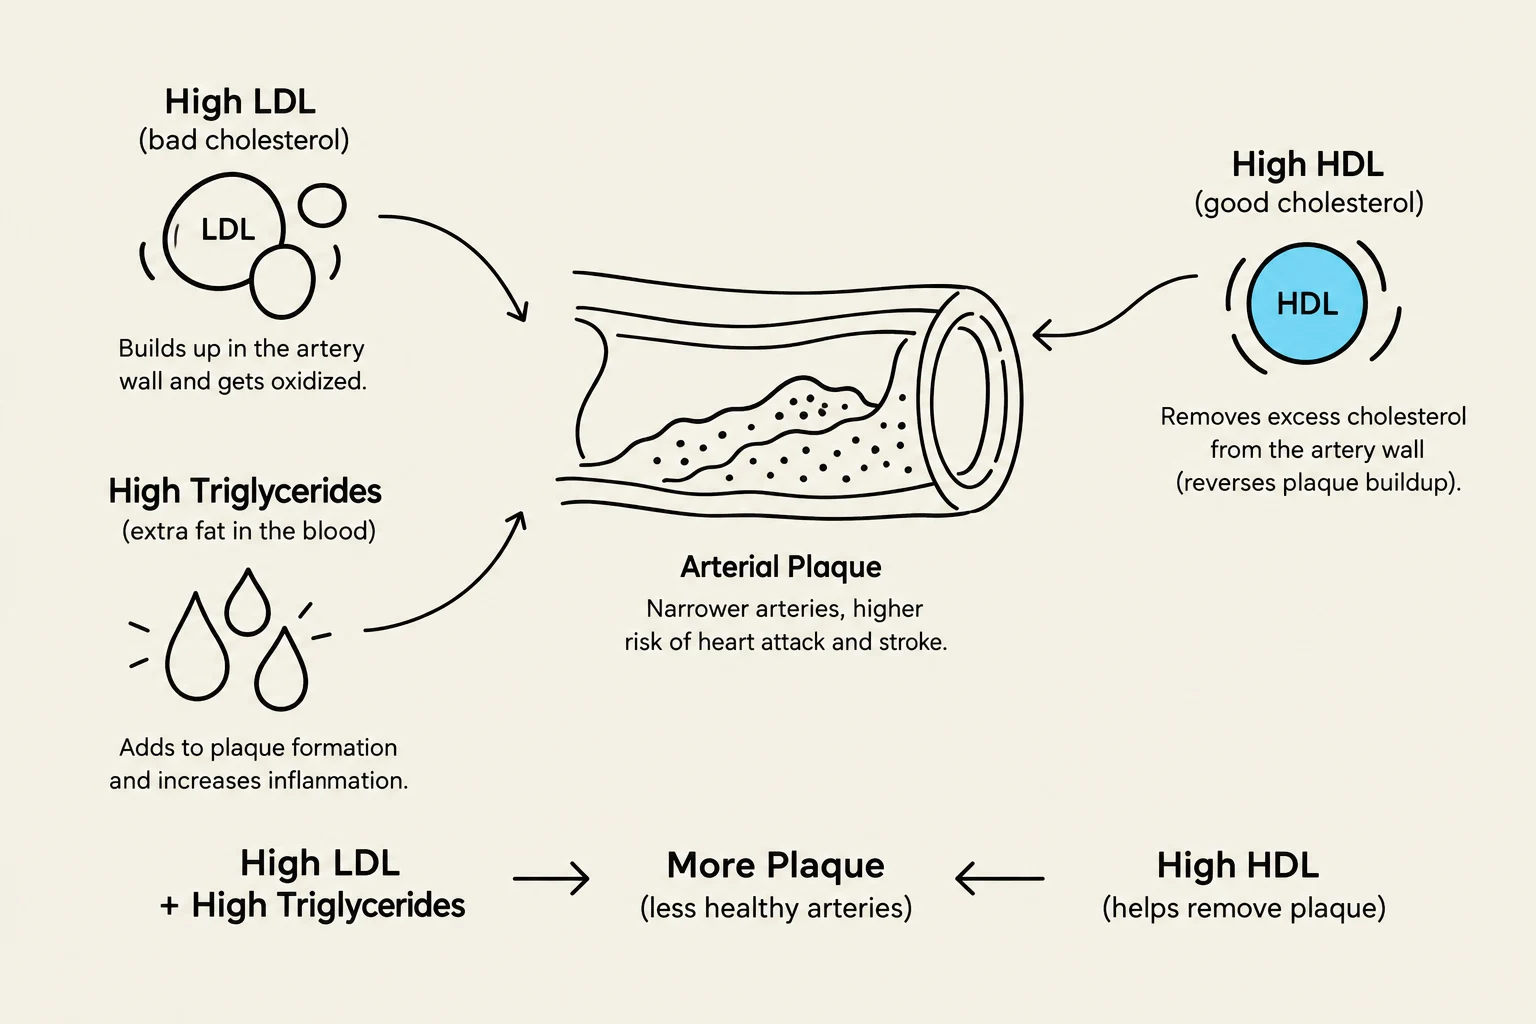
This diagram illustrates how high levels of LDL cholesterol and triglycerides contribute to arterial plaque buildup, narrowing arteries and increasing the risk of heart attack and stroke. High HDL cholesterol helps to remove excess cholesterol from the artery walls.
Summary of Risk Factors
Managing lipid profiles involves a combination of lifestyle modifications and, in some cases, pharmacological intervention. Key areas of focus include:
Dietary Fats: Reducing saturated and trans fats to lower LDL.
Physical Activity: Increasing aerobic exercise to boost HDL.
Weight Management: Reducing excess body fat to lower triglycerides.
By monitoring these values, healthcare providers can implement early interventions to prevent the progression of cardiovascular disease.
Keep reading for free.
Create an account to finish this reading and make it part of your study routine.