Understanding Economic Growth and World Bank Classifications
This content explains key economic indicators like GDP and GNI, the World Bank's income classification system, and factors influencing economic growth such as productivity and labor. It uses country examples to illustrate concepts.
Understanding how nations progress economically requires more than just looking at a single number. Economists use various metrics to measure the wealth of a country, the standard of living of its citizens, and its relative position in the global market. By studying indicators like Gross Domestic Product (GDP) and Gross National Income (GNI), and understanding how organizations like the World Bank categorize these figures, we can gain a clearer picture of a country's economic trajectory and its future potential.
Measuring Economic Activity: GDP and GNI
At the most fundamental level, economic growth is often discussed in terms of Gross Domestic Product (GDP). GDP represents the total market value of all final goods and services produced within a country's borders during a specific period. While GDP is a vital measure of domestic economic activity, it does not always capture the full picture of a nation's actual wealth.
To get a more comprehensive view of a country's economic strength, economists often look to Gross National Income (GNI). Unlike GDP, which focuses on what is produced inside a country, GNI includes the total income earned by a nation's residents, regardless of where that income is generated. This means GNI accounts for Net Income from Abroad—the difference between what citizens earn abroad and what foreign residents earn within the country.
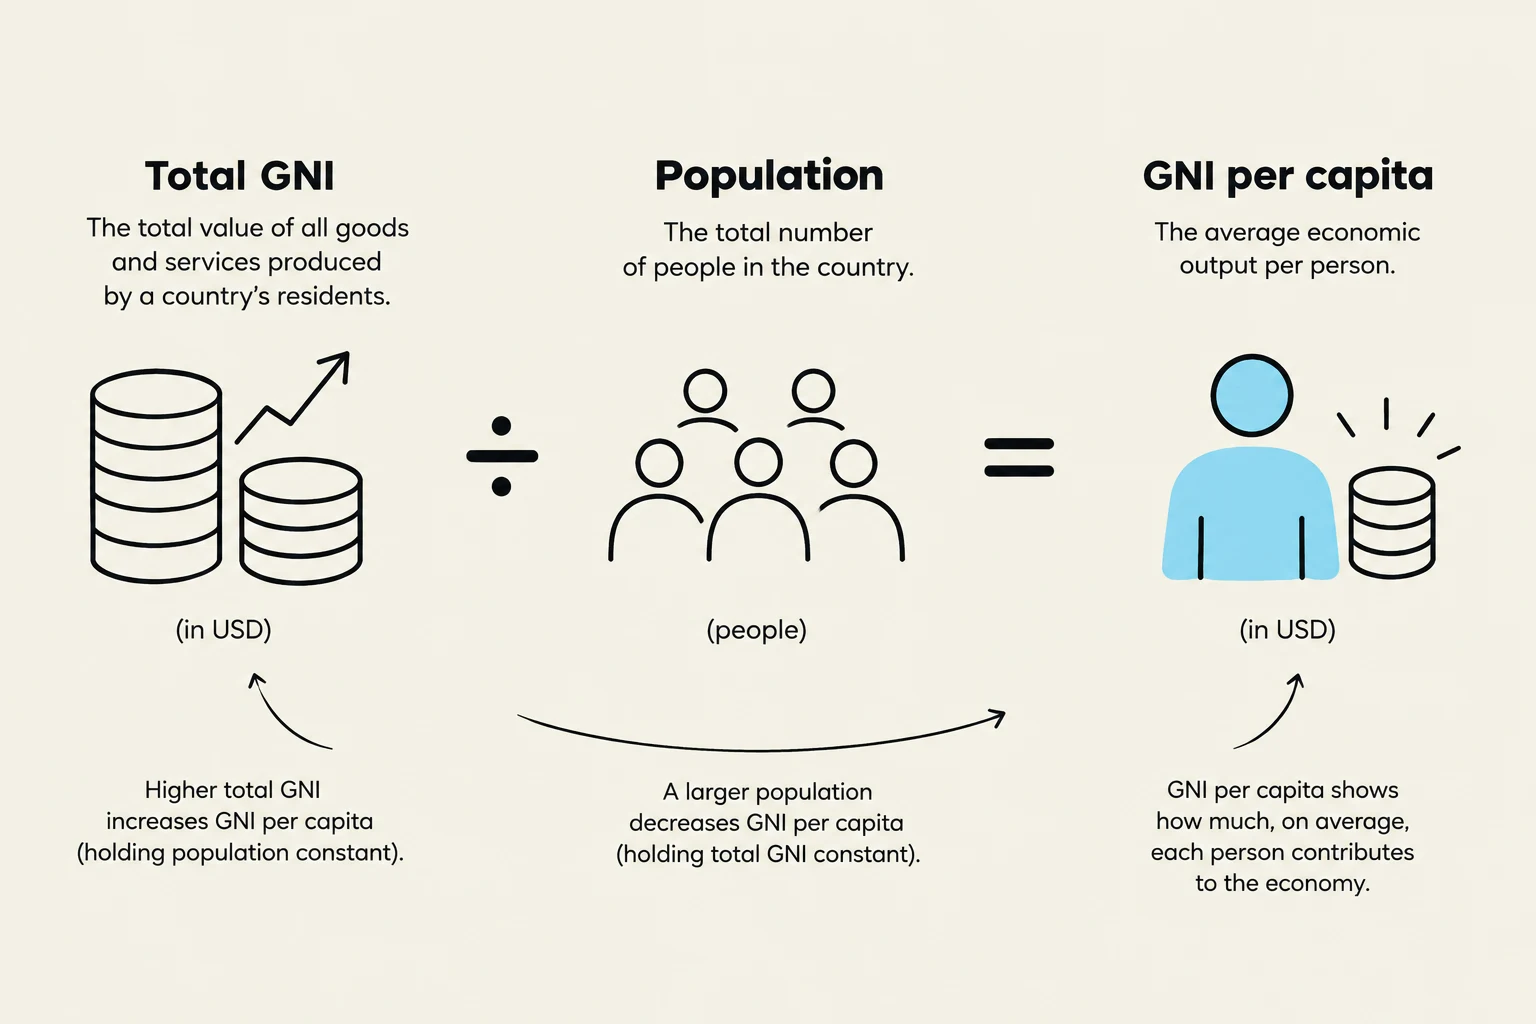
To understand the economic welfare of an individual within these nations, we use GNI per capita. This is calculated by dividing the total GNI by the country's total population:
GNI per capita=Total PopulationTotal GNI
This diagram illustrates the relationship between Total GNI, Population, and GNI per capita, showing how GNI per capita is calculated and what it represents.
The World Bank Classification System
The World Bank provides a standardized way to compare the economic status of different nations. Since 1987, the World Bank has classified its 189 member countries (plus 28 others with significant populations) into four distinct income groups.
These classifications are not static; they are updated annually on July 1st based on the previous calendar year's data. To ensure consistency, the World Bank uses the Atlas method, which converts local currency into current US dollars using specific exchange rates to allow for international comparison.
Exam Tip: Remember that World Bank classifications are updated every July 1st and are based on the previous year's GNI per capita using the Atlas method. These categories are also used to determine a country's lending categories for international aid and loans.
The Four Income Groups
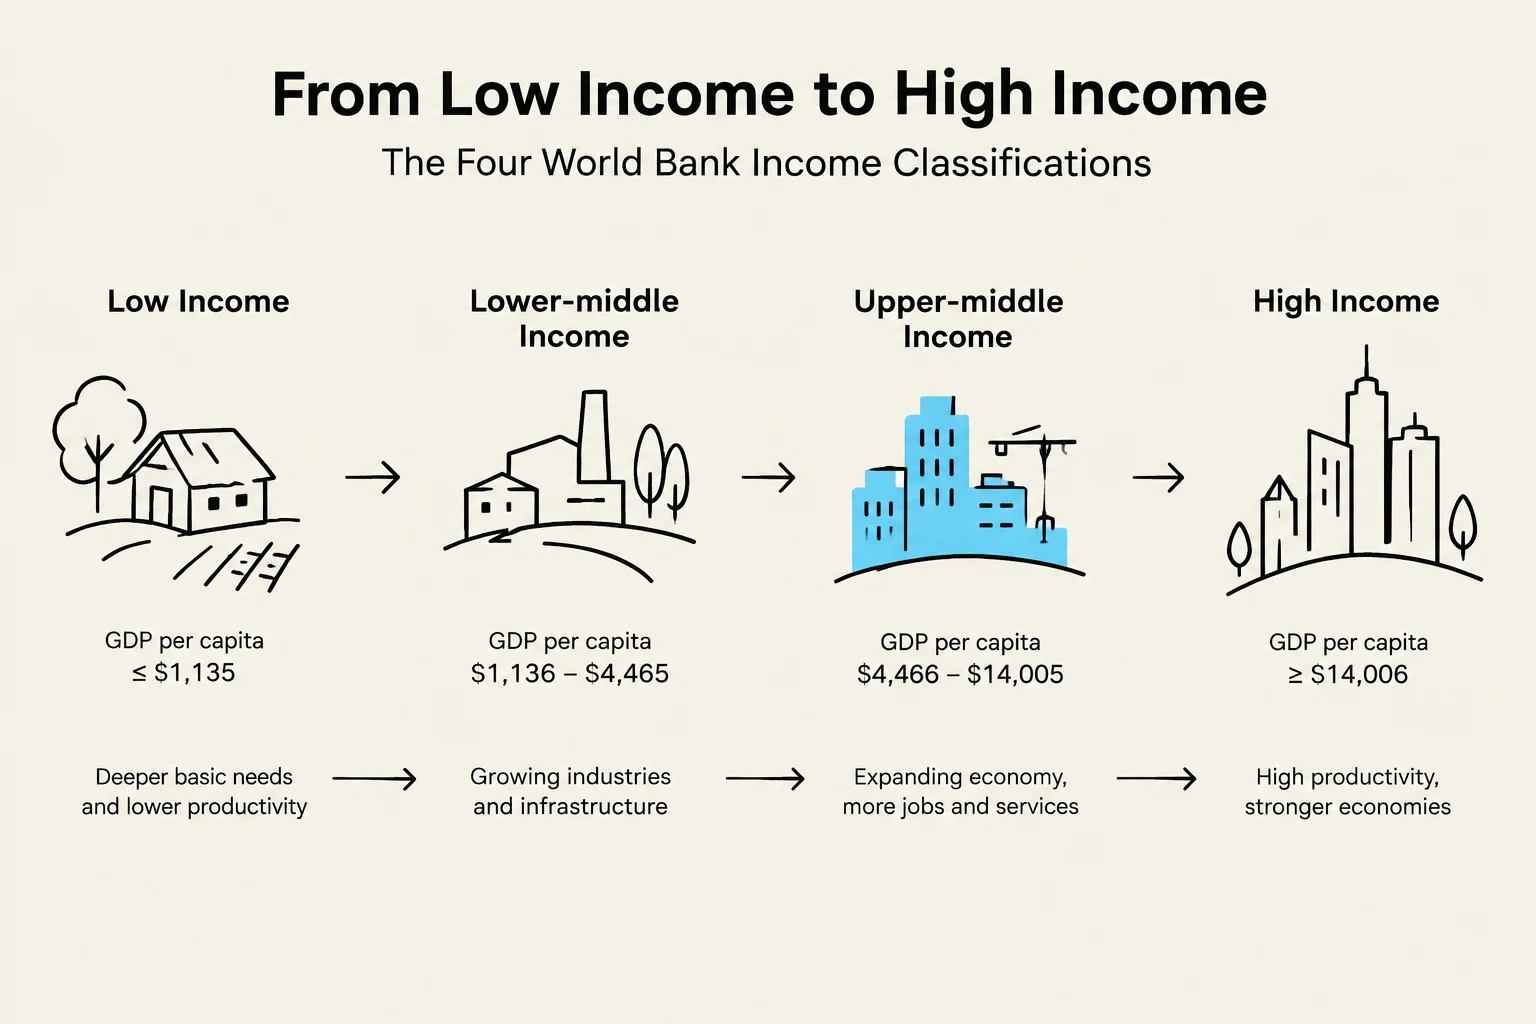
The classification depends on specific GNI per capita thresholds, which are adjusted annually to account for inflation and global economic shifts. Based on 2026 projections, the groups are organized as follows:
High income: Countries with a GNI per capita exceeding $$14,375$. Examples include the United States, Japan, and Singapore.
Upper middle income: Countries falling within the range of $$4,636to$14,375$. This group includes nations like China, Malaysia, and the Philippines (projected).
Lower middle income: Countries in the tier between $$1,176$ and $$4,635$. Examples include India, Vietnam, and Indonesia.
Low income: Countries with a GNI per capita of $$1,175$ or less. This group includes nations such as Ethiopia, Mali, and Burundi.
The image illustrates the four World Bank income classifications: Low Income, Lower-middle Income, Upper-middle Income, and High Income, based on GDP per capita and economic characteristics.
Case Study: The Economic Transition of the Philippines
The Philippines serves as a significant example of economic transition. As of July 1, 2026, the Philippines is projected to reach upper-middle income status, with a GNI per capita of approximately $$4,850$.
However, a comparative analysis reveals a more complex story. While the Philippines has grown, its rate of growth has lagged behind some of its neighbors. For instance, between 1960 and 2025, while the Philippines' GNI per capita grew by 4 times, South Korea's grew by 36 times. Similarly, when comparing the Philippines to China and Vietnam, the Philippines' GNI per capita was nearly 3 times that of China in 1990, but by 2025, China's GNI per capita had grown 17 times, significantly surpassing the Philippines.
Accuracy in Data: Measurement and Units
When analyzing economic growth, it is crucial to recognize that different measurement methods can yield different results. To ensure accuracy, economists must consider several variables:
Exchange Rates: Essential for converting local currency into international standards.
Purchasing Power Parity (PPP): This method adjusts for the differences in the cost of living and inflation between countries. It allows for a more "apples-to-apples" comparison of what a person can actually buy with their income. Data may be expressed in both current and constant international dollars.
Local Currency Units (LCU): Data can also be expressed in the country's own currency, either in current or constant terms.
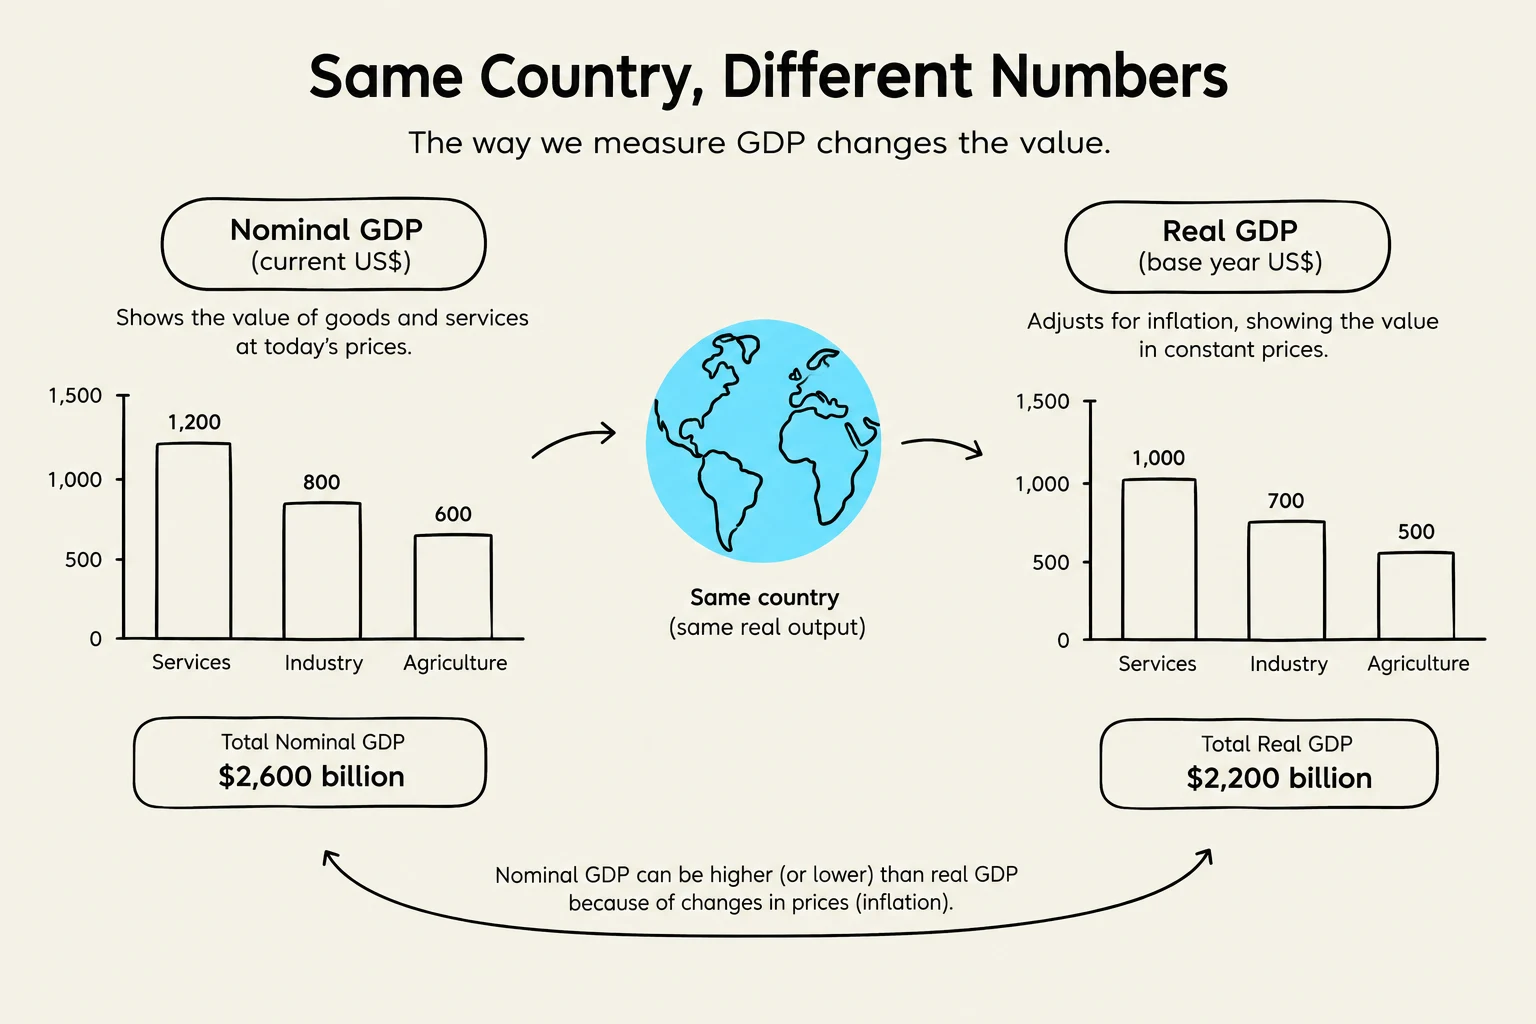
This illustration compares Nominal GDP and Real GDP for the same country, highlighting how inflation affects the perceived value of goods and services. Nominal GDP reflects current prices, while Real GDP adjusts for inflation to show value in constant prices.
Challenges to Sustained Growth: Productivity and Labor
Economic growth is not just about having more people; it is about how productive those people are. A critical driver of long-term prosperity is labor productivity.
In the Philippines, despite increases in productivity, the nation faces challenges compared to its neighbors. For example, in 2023, the productivity of South Korea was significantly higher than that of the Philippines. Furthermore, the Philippines has struggled with a relatively low employment-to-population ratio (approximately 41.1% in 2023) compared to countries like Vietnam or Thailand.
Additionally, demographic shifts play a massive role. A declining fertility rate—which has fallen below the replacement ratio in some regions—means that fewer young people are entering the workforce, which can eventually lead to a shrinking labor force and slower economic growth.
Keep reading for free.
Create an account to finish this reading and make it part of your study routine.