Understanding ECG Waveforms, Segments, and Intervals
This guide explains the fundamental components of an electrocardiogram (ECG), including waveforms (P wave, QRS complex, T wave, U wave), segments (PK segment, ST segment), and intervals (PK interval, QT interval). It details what each component represents in terms of the heart's electrical activity, normal values, and
Understanding the Electrocardiogram (ECG) is fundamental to clinical practice. An ECG is a visual representation of the electrical activity traveling through the heart, captured as deflections from a baseline. To read an ECG accurately, you must distinguish between three distinct types of electrical markers: waveforms (the peaks and valleys), segments (the flat lines between waves), and intervals (which combine a wave and a segment).
A helpful mnemonic for students is: Segments are flat; Intervals include a wave.
The Waveforms: The Heart's Electrical Peaks
Waveforms represent the actual depolarization (electrical activation) and repolarization (electrical resetting) of the heart's chambers.
The P Wave: Atrial Depolarization
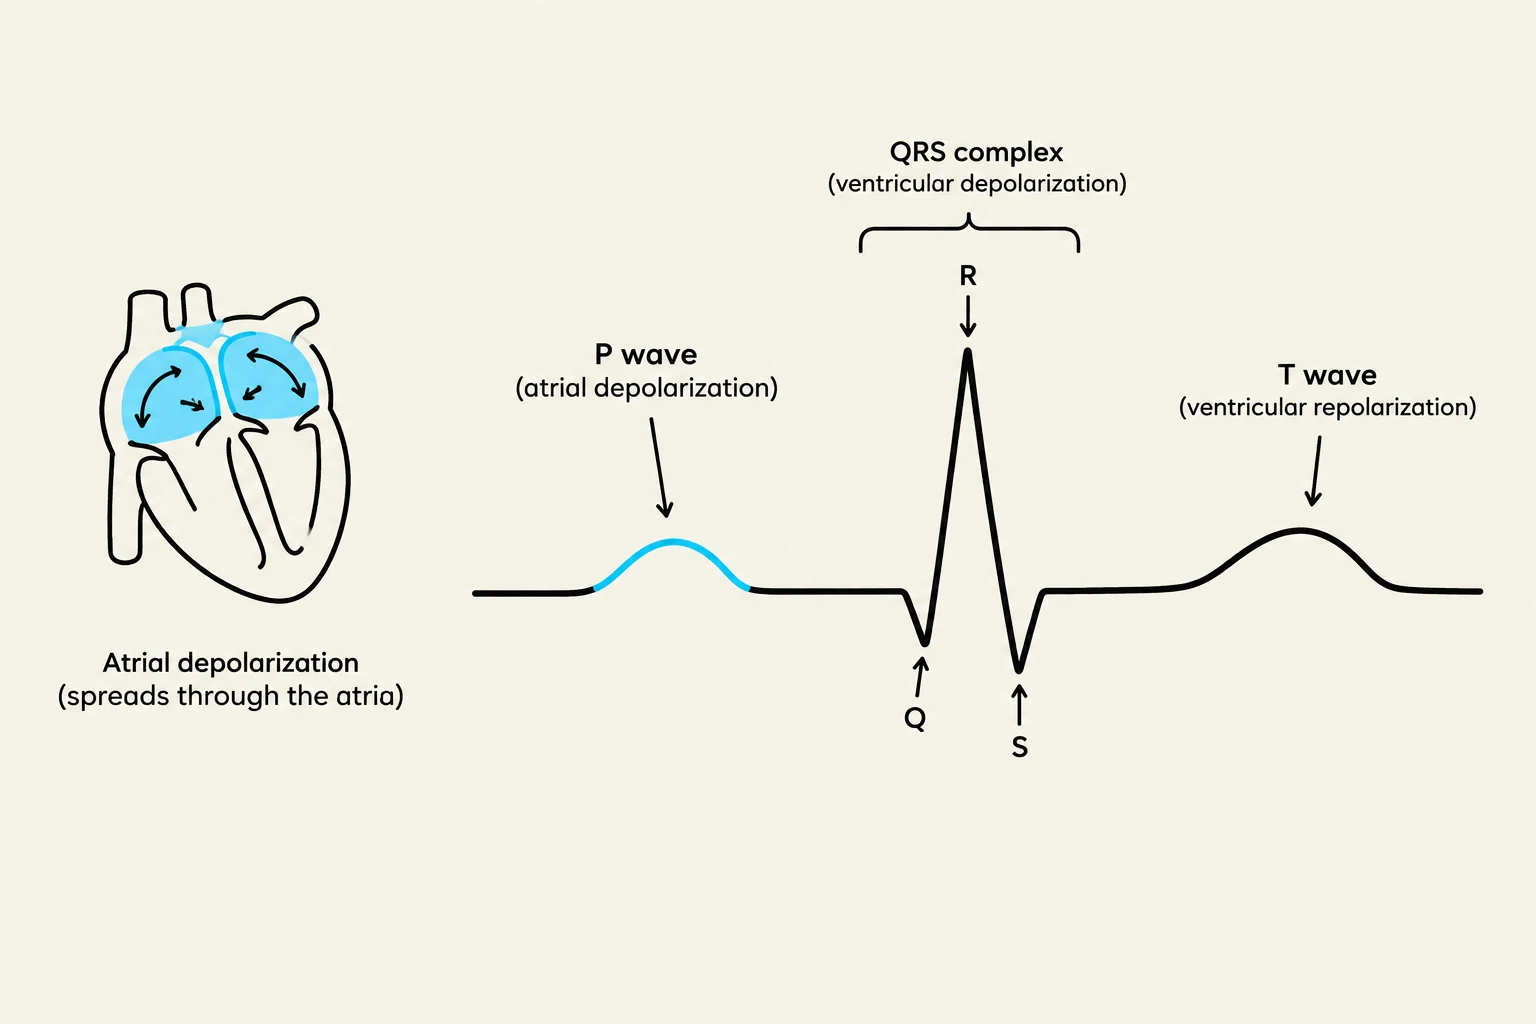
The P wave is the first deflection seen on a normal ECG. It represents atrial depolarization, where the electrical impulse originates from the SA node and spreads through the atria. In a normal sinus rhythm, you should see a consistent, upright P wave before every QRS complex.
Clinical Variations: If P waves are absent or replaced by "sawtooth" waves, it may indicate Atrial Fibrillation (AFD) or Atrial Flutter.
Diagram illustrating the components of an electrocardiogram (ECG), including the P wave, QRS complex, and T wave, alongside a simplified representation of atrial depolarization in the heart.
The QRS Complex: Ventricular Depolarization
The QRS complex represents the rapid spread of electricity through the ventricles. It consists of three parts: the Q wave (first negative deflection), the R wave (first positive deflection), and the S wave (second negative deflection).
The width of the QRS is a critical diagnostic clue:
Narrow QRS (< 0.12 sec): Suggests the impulse traveled through the normal, fast conduction pathways (supraventricular origin).
Wide QRS (> 0.12 sec): Suggests the impulse is traveling slowly from cell to cell, often indicating a ventricular origin, such as a Premature Ventricular Contraction (PVC) or Ventricular Tachycardia (VT).
The T Wave and U Wave: The Reset Phase
After the ventricles contract, they must electrically "reset" to prepare for the next beat. This is known as repolarization.
T Wave: Represents ventricular repolarization. It is typically upright and rounded.
U Wave: A small, rounded deflection that sometimes follows the T wave. While its exact cause is debated (possibly Purkinje repolarization), a prominent U wave is a classic clinical sign of hypokalemia (low potassium).
Exam Tip: Watch out for the "no-T" phenomenon. If an early beat lands on the T wave, it can trigger a dangerous rhythm called Torsades de Pointes.
The Segments: The Flat Lines
Segments are the isoelectric (flat) lines between waveforms. They represent periods where no significant depolarization or repolarization is occurring in the measured area.
The PK Segment
The PK segment is the flat line between the end of the P wave and the start of the QRS complex. It represents the "pause at the gatekeeper," where the impulse travels through the AV node and the His-Purkinje system.
The ST Segment
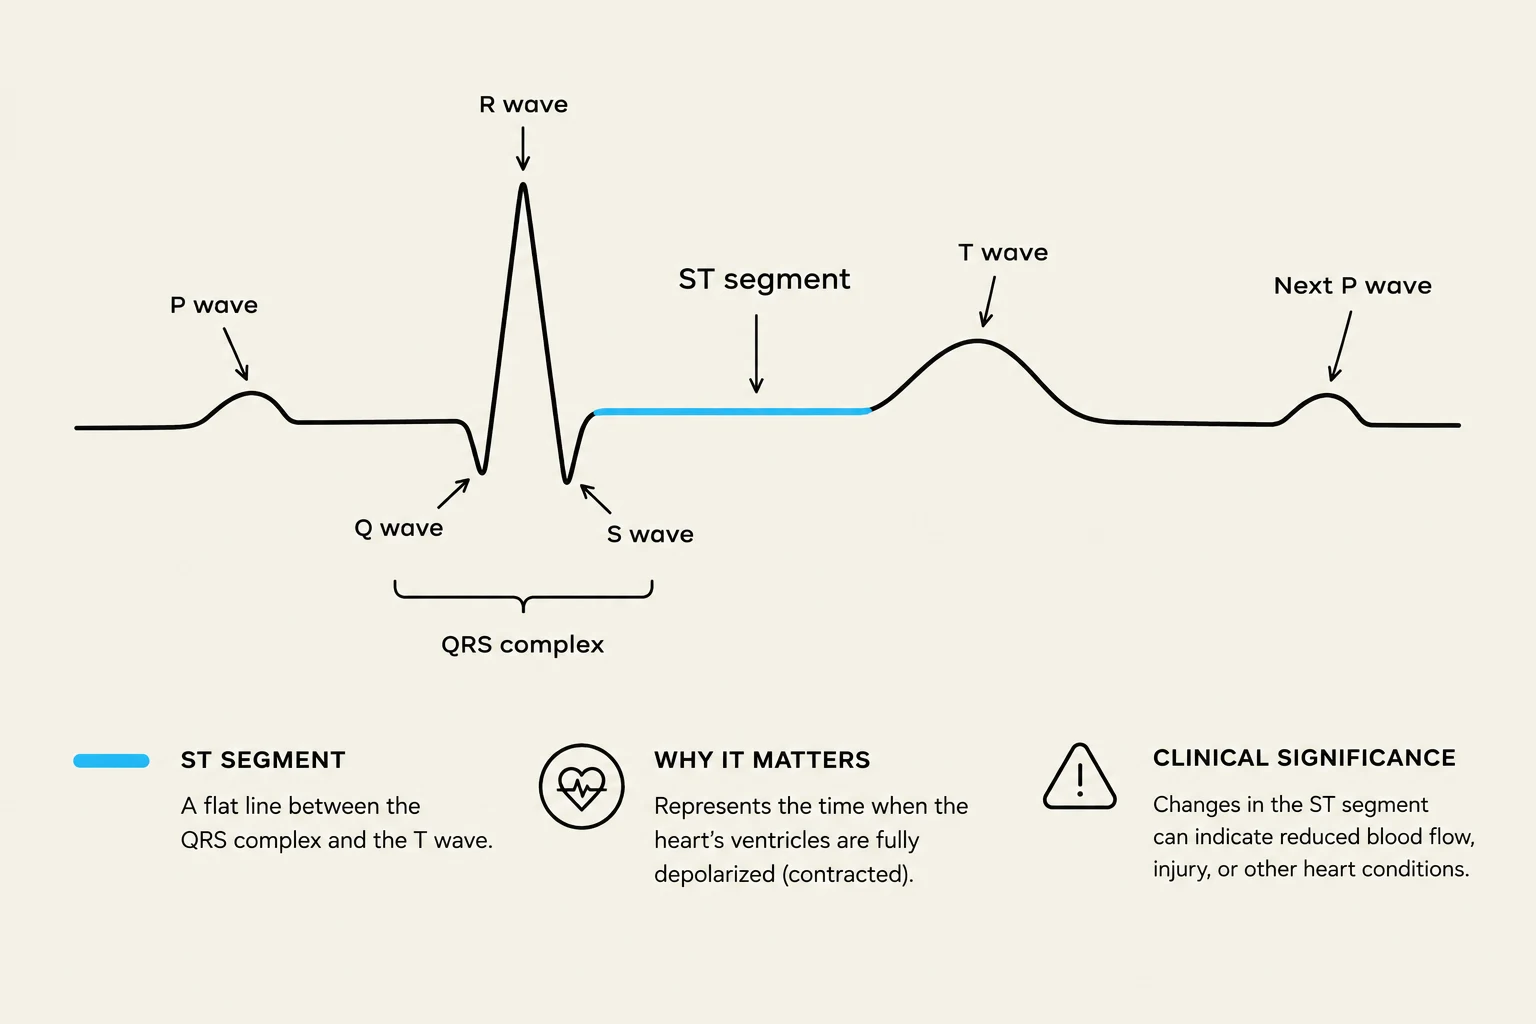
The ST segment is the flat line between the end of the QRS and the start of the T wave. This represents the "plateau phase" of ventricular activity.
Clinical Significance: This is the most vital segment for identifying cardiac emergencies. ST elevation is a hallmark of an acute Myocardial Infarction (MI), while ST depression often indicates ischemia.
An electrocardiogram (ECG) waveform illustrating the P wave, QRS complex, T wave, and ST segment, with explanations of their meaning and clinical significance.
The Intervals: Measuring Time and Conduction
Intervals are more complex than segments because they include at least one waveform, allowing us to measure the time it takes for an impulse to travel through specific parts of the heart.
The PK Interval
The PK interval measures the time from the start of the P wave to the start of the QRS complex. It tracks the conduction from the atria through the AV node.
Normal: 0.12 to 0.20 seconds (3 to 5 small boxes).
Abnormality: A consistently prolonged PK interval (> 0.20 seconds) is diagnostic of a First-degree AV block.
The QT Interval
The QT interval measures the total time for both ventricular depolarization and repolarization. Because the heart rate changes the timing of these events, the normal QT interval varies with the heart rate (it is shorter at fast rates and longer at slow rates).
Clinical Risk: A prolonged QT interval is a dangerous substrate for Torsades de Pointes. Causes include congenital long QT syndrome, certain medications, or electrolyte imbalances like low potassium or magnesium.
An electrocardiogram (ECG) showing the P wave, QRS complex, and T wave, along with the QT interval.
Summary Reference Table
Component
Type
Represents
Normal
Abnormality → Rhythm
P wave
Waveform
Atrial depolarization
Upright, < 0.12 sec
Absent → AFD; Sawtooth → Flutter
PK interval
Interval
Atrial → AV node conduction
0.12-0.20 sec
> 0.20 sec → 1st degree block
QRS complex
Waveform
Ventricular depolarization
< 0.12 sec
Wide → PVC/VT; Absent → VT
ST segment
Segment
Ventricular plateau
Isoelectric
Elevated → MI; Depressed → Ischemia
T wave
Waveform
Ventricular repolarization
Upright, rounded
"No-T" → Torsades risk
QT interval
Interval
Depolarization + repolarization
Varies with rate
Prolonged → Torsades risk
U wave
Waveform
Purkinje repolarization?
Small, often absent
Prominent → Hypokalemia
Systematic Reading Order
When approaching an ECG strip, follow this standardized sequence to avoid missing critical findings:
Rate: Is it fast, slow, or normal?
Rhythm: Is it regular or irregular?
P waves: Are they present? Are they consistent? Is there one P wave for every QRS?
PK interval: Is it within the 3–5 small box range?
QRS: Is it narrow or wide?
ST segment: Is it isoelectric (flat) or shifted (elevated/depressed)?
QT: Is the interval prolonged?
The One-Liner:P is atria, QRS is ventricles, T is the reset. PK is the AV delay, and QT is the whole ventricular event.
Keep reading for free.
Create an account to finish this reading and make it part of your study routine.