When we study how two different variables relate to one another, we are looking for a "correlation." In statistics, correlation helps us describe the pattern of a relationship between two sets of data. For example, does the amount of time spent studying relate to higher test scores? Does the temperature outside relate to ice cream sales? To answer these questions, we look at two primary characteristics of a relationship: its direction and its strength.
Visualizing Data with Scatter Plots
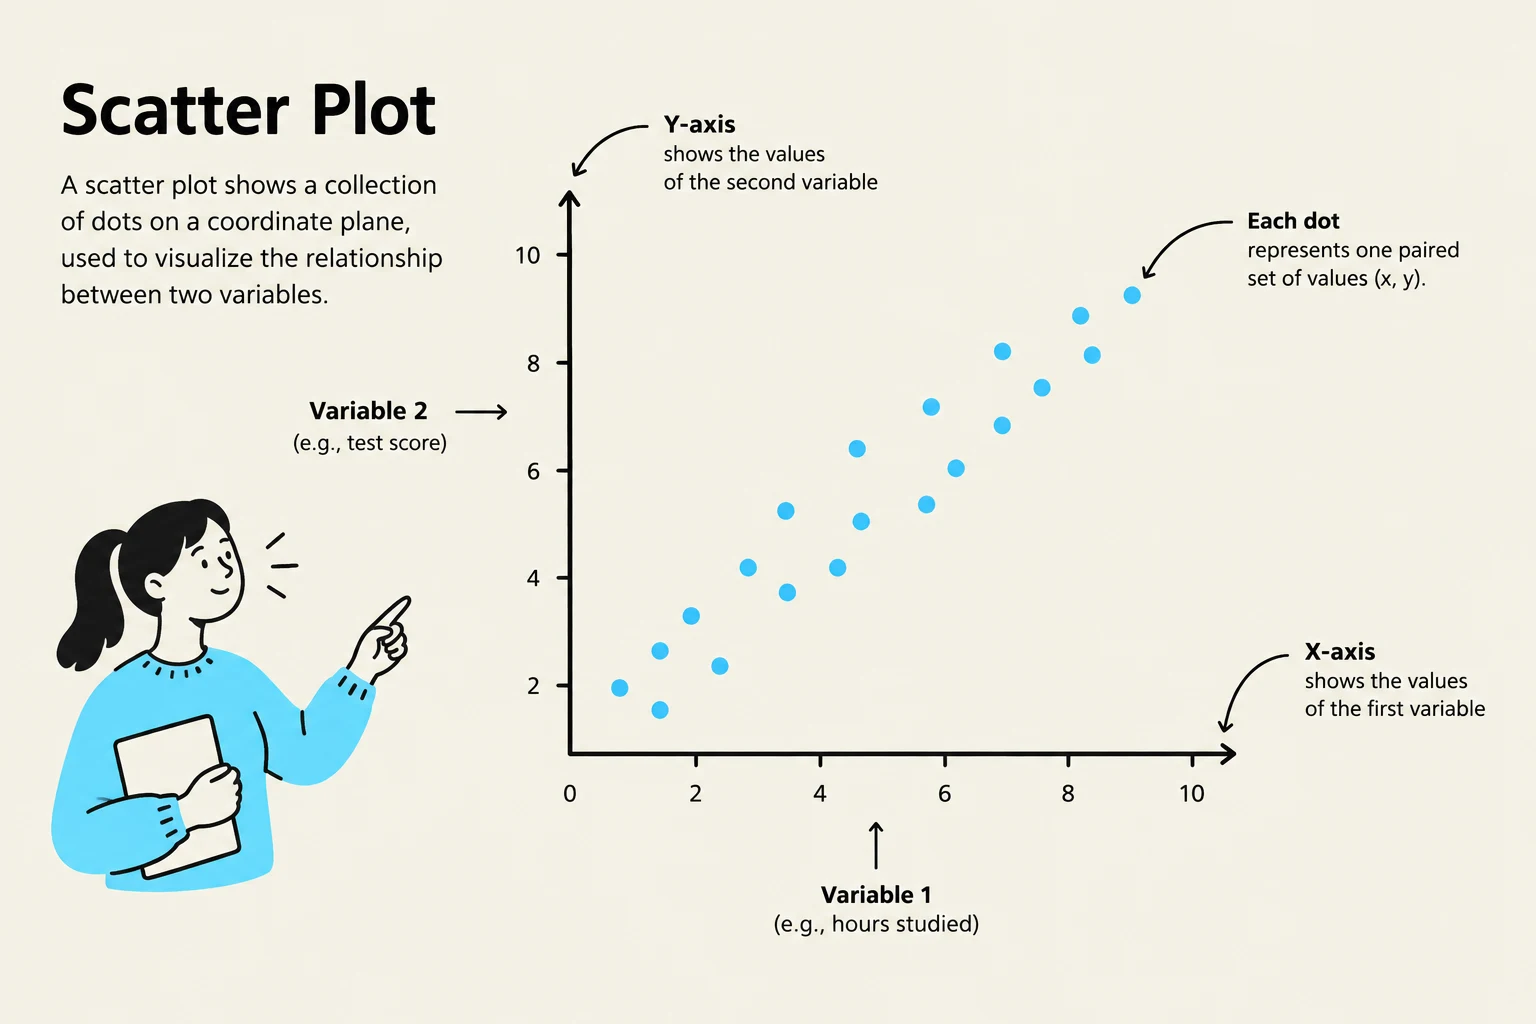
Before we can calculate mathematical values, we must first visualize the data. The most common way to see a correlation is through a scatter plot. A scatter plot uses a coordinate plane where each individual data point is represented by a dot. By looking at the overall "cloud" or pattern formed by these dots, we can make immediate visual judgments about how the variables are interacting.
A scatter plot is a graph that displays data points on a coordinate plane to visualize the relationship between two variables. The X-axis represents the first variable, and the Y-axis represents the second variable. Each dot on the plot signifies a paired set of values for these two variables.
Determining Correlation Direction
The "direction" of a correlation tells us whether the variables move together or in opposite directions. This is often described as the slope of the trend within the scatter plot.
Positive Direction
A positive correlation occurs when both variables move in the same direction. As one variable increases, the other tends to increase as well. On a scatter plot, this looks like a pattern of dots "going up" from the bottom-left toward the top-right.
Negative Direction
A negative correlation occurs when the variables move in opposite directions. As one variable increases, the other decreases. Visually, this appears as a pattern of dots "going down" from the top-left toward the bottom-right.
Exam Tip: If you see a graph where the dots are climbing a hill, it is positive. If they are sliding down a hill, it is negative.
Measuring Correlation Strength
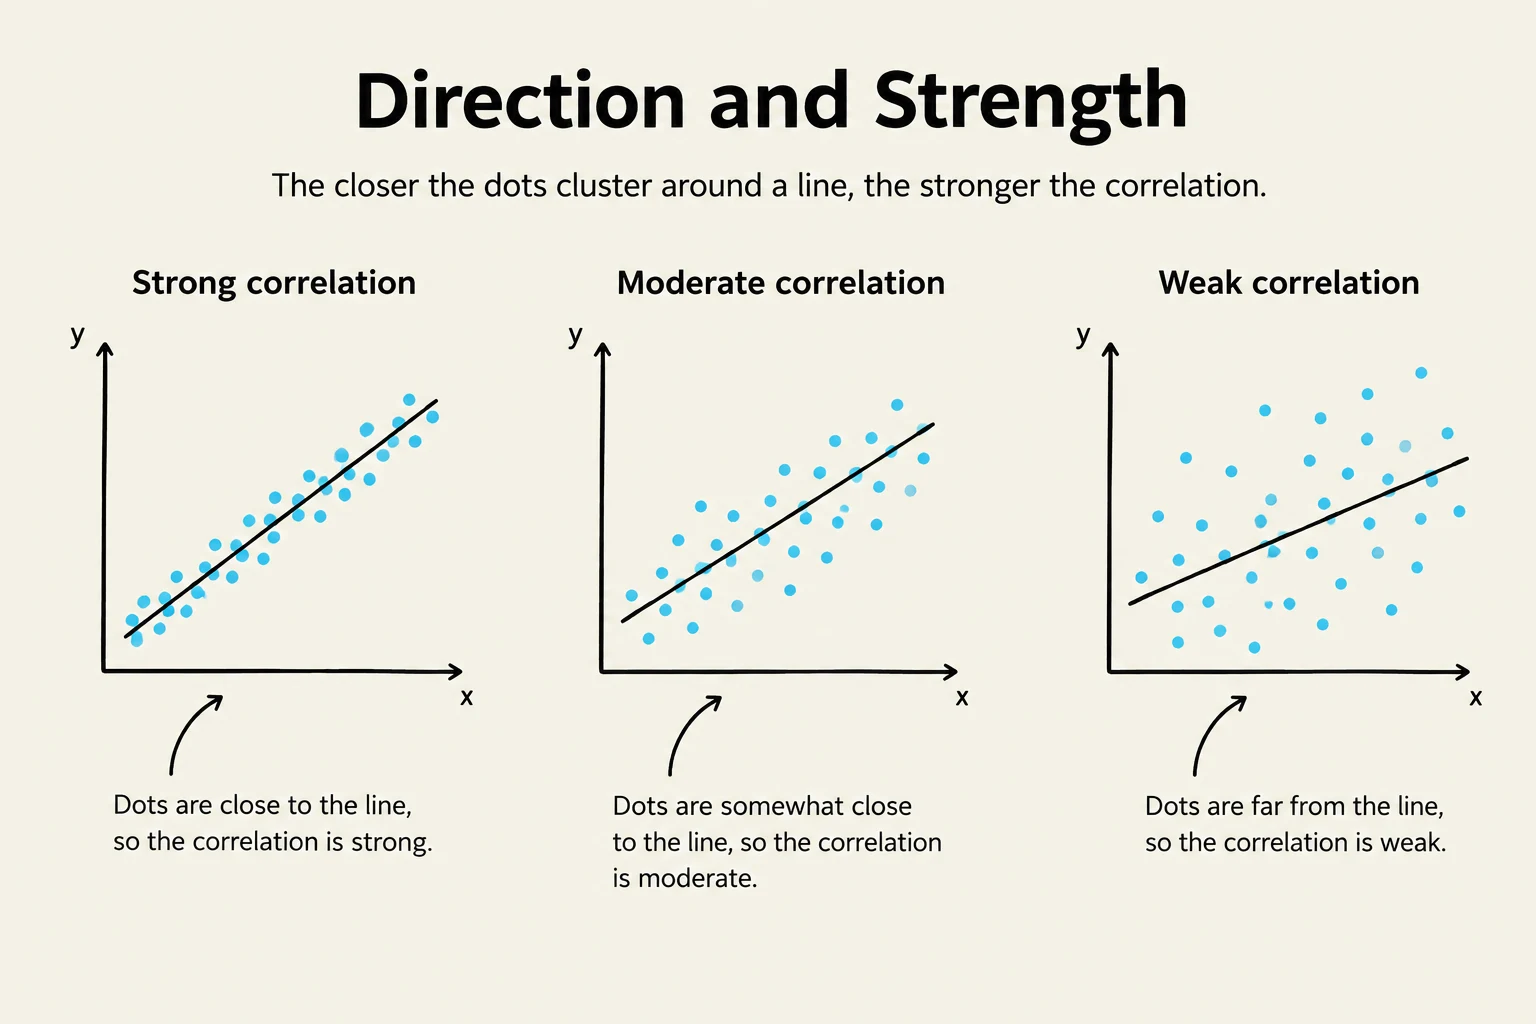
While direction tells us which way the relationship is moving, strength tells us how closely the data points follow a specific path or line. We measure this by looking at how much "scatter" there is around the imaginary line of best fit.
Strong Correlation: The points are very close to the imaginary line. There is very little deviation from the pattern.
Moderate Correlation: The points follow a clear direction, but they are somewhat spread out from the line.
Weak Correlation: The points are widely scattered. While you might be able to see a slight trend, there are many points that do not follow the pattern closely.
This illustration demonstrates the concept of correlation strength using scatter plots. It shows how the proximity of data points to a regression line indicates the strength of the correlation, with points clustered tightly around the line representing a strong correlation, and points spread further away indicating a weak correlation.
The Correlation Coefficient and the Number Line
In formal statistics, we use a number called the correlation coefficient to quantify these observations. This number typically falls on a scale from −1.0 to 1.0.
The sign of the number tells us the direction, and the distance from zero tells us the strength. We can map these values onto a number line to better understand the relationship:
Value
Direction
Strength
1.0
Positive
Strong
0.8
Positive
Moderate
0.5
Positive
Weak
0.0
None
No Correlation
−0.5
Negative
Weak
−0.8
Negative
Moderate
−1.0
Negative
Strong
As shown in the mapping above, a value of 1.0 represents a perfect positive correlation, while −1.0 represents a perfect negative correlation. The closer the value is to 0.0, the weaker the relationship becomes.
Summary Checklist:
Look at the slope: Upward = Positive; Downward = Negative.
Look at the tightness: Clustered = Strong; Spread out = Weak.
Check the number: Far from zero = Strong; Near zero = Weak.
Keep reading for free.
Create an account to finish this reading and make it part of your study routine.