Examines the environmental impact of data centers, focusing on their electricity demand, water usage for cooling, and land footprint. It analyzes these impacts across local, regional, and global scales, highlighting the interconnectedness of carbon, water, and land footprints and the environmental trade-offs involved i
When we interact with artificial intelligence—whether asking a chatbot to write an essay or generating a digital image—the process feels weightless, existing in a "cloud" far above the physical world. However, this digital experience is deeply materialized. Behind every query lies a global web of hardware, transmission networks, and massive data centres that require concrete, copper, silicon, and vast amounts of natural resources. To understand the true cost of our digital lives, we must look beyond the screen and examine the environmental footprint of the infrastructure that powers it.
The Triple Footprint: Energy, Water, and Land
The environmental impact of a data centre is typically analyzed through three primary lenses: electricity demand, water requirements, and land usage. These three factors are often in tension with one another, meaning a solution for one can exacerbate another.
1. Electricity Demand and the Energy Mix
Data centres require immense amounts of electricity to power the servers used for both training large-scale AI models and the ongoing deployment of those models. Interestingly, the "cleanliness" of this energy is not uniform. The carbon footprint of a data centre depends heavily on the energy mix of the country where it is located. For example, a data centre running on a coal-heavy grid will have a significantly higher carbon footprint than one powered by renewables, even if they perform the exact same computations.
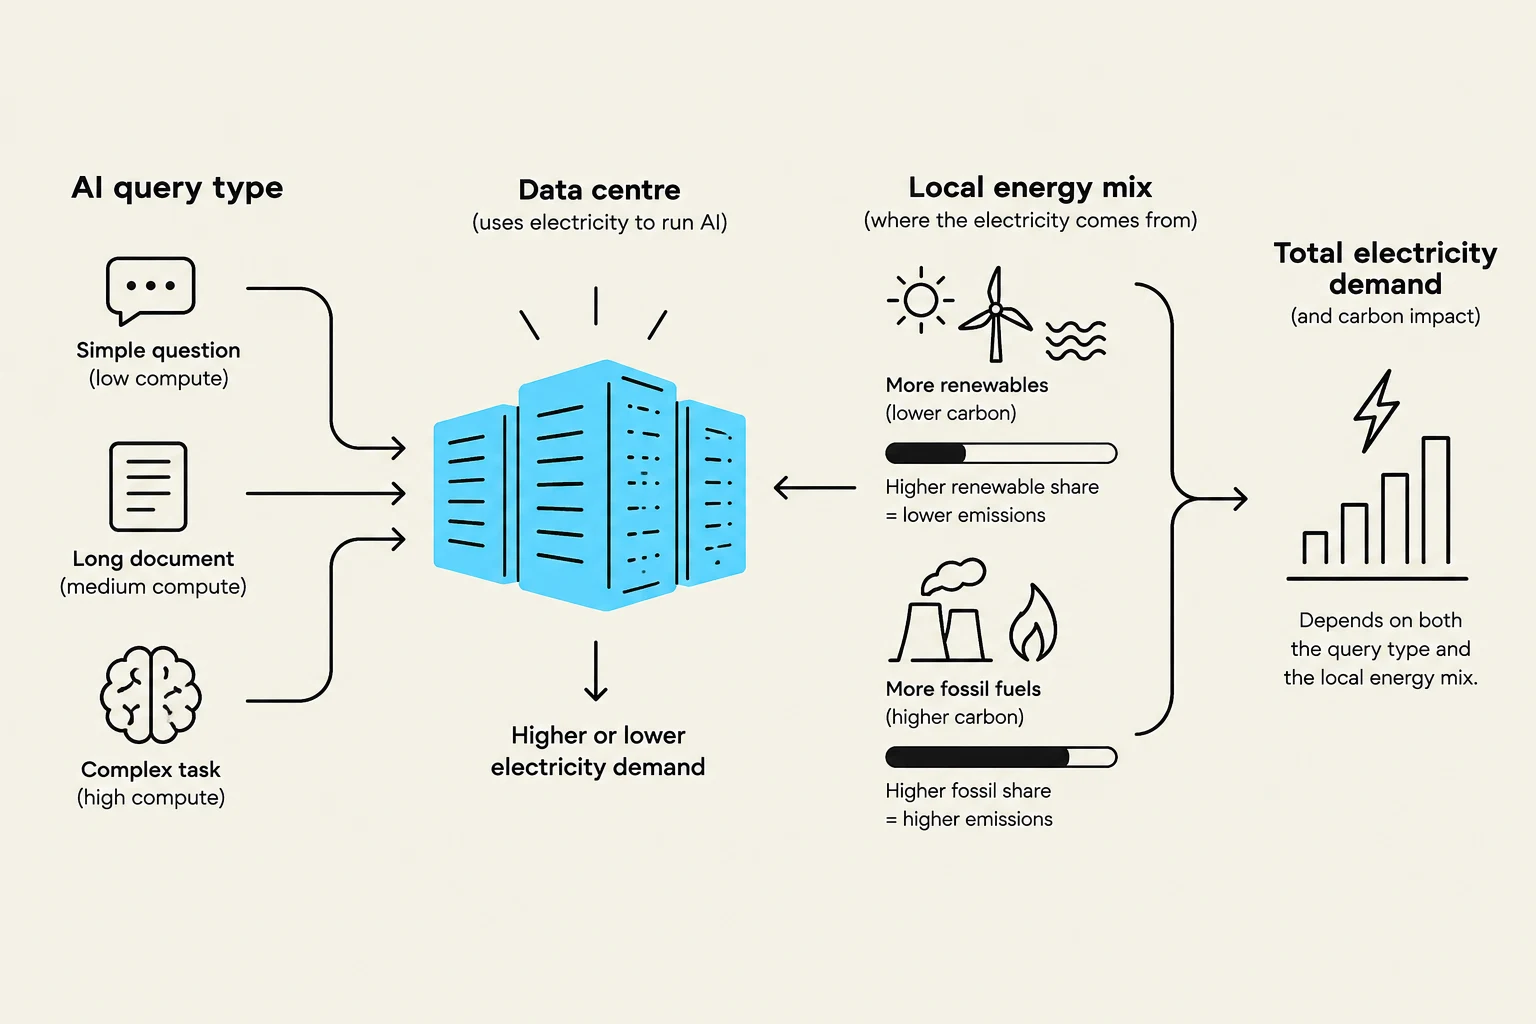
Furthermore, the demand for power is not static; it fluctuates based on the specific functions and complexity of the queries requested of the AI.
This diagram illustrates how different AI query types interact with data centers, influencing electricity demand. The local energy mix, comprising renewables and fossil fuels, then determines the carbon impact of the total electricity demand.
2. Water-Based Cooling and Local Supplies
As server density increases to handle complex AI workloads, heat management becomes a critical challenge. Most high-density server facilities rely on water-based cooling to prevent hardware failure. This creates a direct pressure on local water supplies.
Large-scale withdrawals of cooling water can place significant stress on aquifers and surface water systems. This is particularly dangerous in arid regions or areas already suffering from groundwater depletion. It is also important to recognize that the water footprint isn't just about the cooling towers; it can also stem from the electricity generation itself, such as through hydro-electric generation.
3. Land Footprint and Environmental Trade-offs
The land footprint includes both the physical site of the data centre and the vast areas required to generate the energy needed to offset its emissions.
A crucial concept for students to grasp is the environmental trade-off. A data centre might achieve a low carbon footprint by using renewable energy, but this might result in a very high water footprint (if using hydro-power) or a massive land footprint (if using sprawling solar or wind farms).
This diagram illustrates the carbon, water, and land footprints associated with data centers, along with two examples of trade-offs between these factors.
Exam Tip: When discussing the environmental impact of AI, avoid treating "carbon footprint" as the only metric. Always mention the interconnectedness of the "Triple Footprint" (Carbon, Water, and Land) and how optimizing one often impacts the others.
Scales of Assessment
To fully understand the costs and benefits of data centre development, we cannot look at a single point on a map. We must assess the impacts across three distinct scales: local, regional/national, and global.
Local Scale
At the local level, the impacts are often felt most acutely by the immediate community. These include:
Resource Consumption: Direct use of local water and land.
Social Impacts: Effects on Indigenous land rights and the visual landscape.
Quality of Life: Noise pollution from cooling fans and heavy machinery.
Economic Factors: The creation of local jobs and the generation of local tax revenue.
Regional and National Scale
Moving up a level, the impacts affect the broader economy and social fabric of a country:
Infrastructure & Economy: Impacts on food production (due to land use), fluctuations in national energy costs, and overall economic growth.
Societal Anxiety: Concerns regarding the impact of AI on job security and a growing distrust of foreign "Big Tech" companies operating within national borders.
Digital Sovereignty: The ability of a nation to control its own digital destiny and data.
Global Scale
Finally, at the global scale, the implications reach the entire planet:
Climate Change: The cumulative impact of fossil fuel use driven by global data demand.
Equity: The uneven distribution of access to the benefits of AI.
Corporate Power: The continued expansion and concentrated power of a few global tech firms.
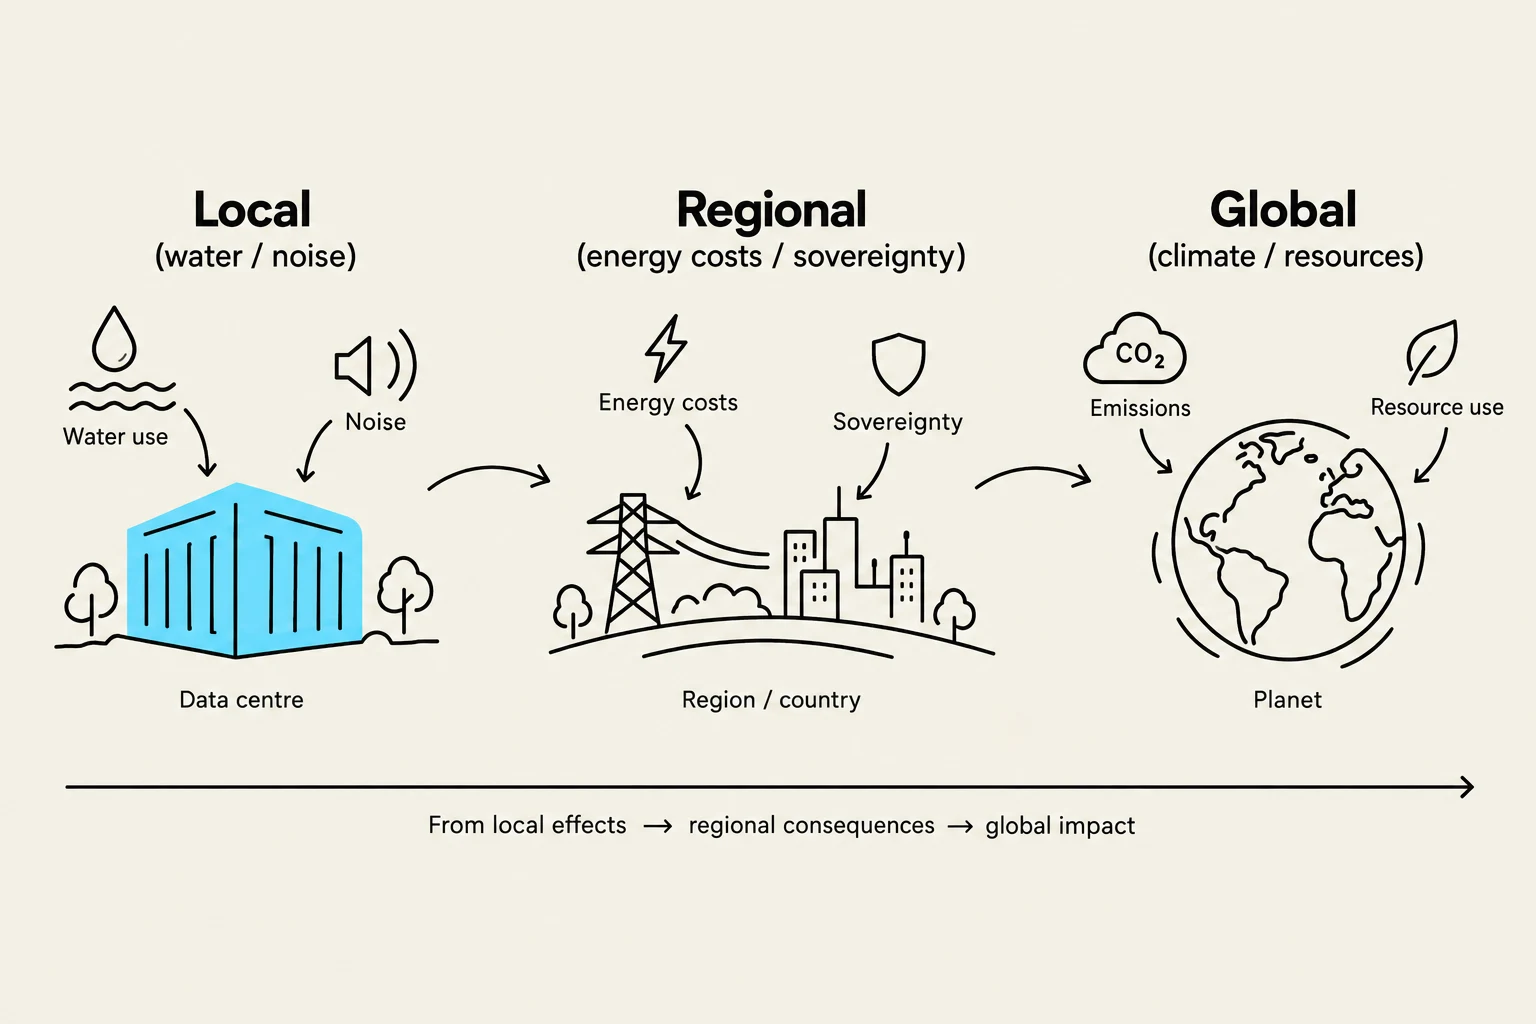
This diagram illustrates the cascading effects of a data center's operations from local impacts like water use and noise, to regional consequences such as energy costs and sovereignty concerns, and finally to global impacts including emissions and resource use.
Summary Table: The Environmental Trade-offs
Metric
Primary Driver
Potential Environmental Risk
Carbon Footprint
Energy Mix (Fossil vs. Renewable)
Global climate change and greenhouse gas emissions.
Water Footprint
Cooling needs & Hydro-electricity
Depletion of aquifers and stress on local surface water.
Land Footprint
Physical sites & Renewable energy farms
Loss of biodiversity and displacement of agriculture/communities.
Note on Lifecycle: Remember that the environmental impact does not end when a data centre is built. The "upstream" extraction of minerals (like gold, tungsten, and lithium) and the "downstream" generation of e-waste (which could reach 2.5 million metric tons annually by 2030) are essential parts of the total environmental cost.
Keep reading for free.
Create an account to finish this reading and make it part of your study routine.