Understanding how the heart functions requires a dual perspective: the electrical signals that trigger movement and the mechanical pressure changes that drive blood flow. This article explores the relationship between these two systems, the specialized conduction pathway, and the comprehensive Wiggers Diagram used to visualize them.
The Cardiac Conduction System
The heart does not beat randomly; each heartbeat is driven by a specific chain of electrical impulses known as the cardiac conduction system. On a cellular level, this process is driven by an action potential, which involves the movement of positive ions—specifically potassium (K+), calcium (Ca++), and sodium (Na+)—in and out of the cardiac myocytes.
Depolarization and Repolarization
The electrical state of a cell determines its physical action:
Depolarization: When positive ions enter a cardiac cell, the cell becomes depolarized. This electrical event leads directly to muscle contraction.
Repolarization: This is the recovery phase where the cell returns to its resting state (polarized), allowing the muscle to relax.
The Pathway of the Impulse
The electrical signal follows a precise anatomical route to ensure the heart contracts in a coordinated fashion:
SA Node (Sinoatrial Node): Located in the right atrium, this is the "pacemaker" of the heart. The cycle begins here with depolarization.
AV Node (Atrioventricular Node): The signal travels through internodal tracts to the AV node. Crucially, the AV node holds the signal momentarily, providing enough time for the atria to contract and the ventricles to fill with blood.
Bundle of His and Branch Bundles: The signal then moves into the ventricles via the Bundle of His, which splits into the Right and Left Branch Bundles.
Purkinje Fibers: Finally, the signal reaches the tiny Purkinje fibers, which distribute the impulse throughout the ventricular muscle to trigger contraction.
Diagram of the human heart showing the electrical conduction system, including the SA node, AV node, bundle of His, bundle branches, and Purkinje fibers.
Extrinsic Innervation
While the heart has its own internal conduction system, its rate and strength are modulated by external influences known as extrinsic innervation.
Feature
Sympathetic Nervous System
Parasympathetic Nervous System
Heart Rate
Increases HR
Slows HR
Contraction
Increases force of contraction
—
Context
"Fight, flight, or freeze"
Stimulated during times of rest
Other
—
Increases with fitness or medication
Pressure Gradients and the Cardiac Cycle
The cardiac cycle is the sequence of events in one complete heartbeat, consisting of one ventricular contraction period (systole) and one ventricular relaxation period (diastole).
The Role of Pressure
Everything in the cardiac cycle is driven by pressure. Blood flows naturally from areas of higher pressure to areas of lower pressure. This difference is known as a pressure gradient.
The relationship between electrical and mechanical events is strictly ordered: the electrical event always precedes the physical/mechanical event. Depolarization causes contraction, which increases ventricular pressure; this pressure change is what forces the heart valves to open or close.
The Wiggers Diagram
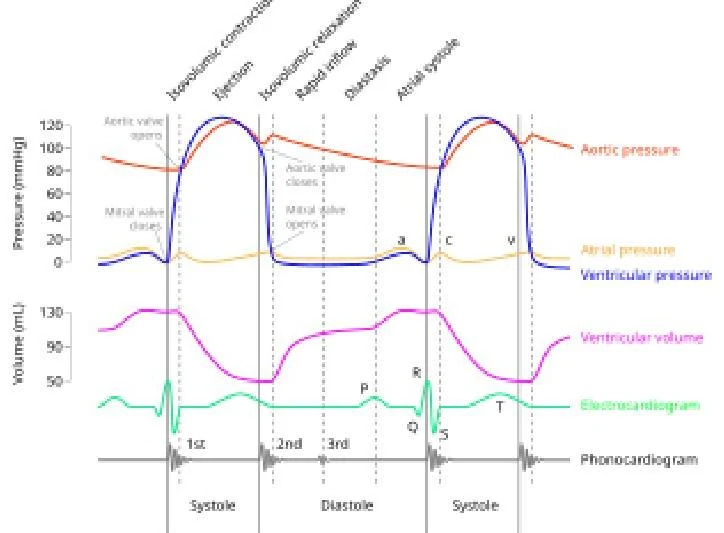
To study these complex relationships, physiologists use the Wiggers Diagram. This single diagram integrates electrical activity (ECG), cardiac pressures, ventricular volume, and heart sounds.
This diagram illustrates the pressure and volume changes in the left ventricle during a cardiac cycle, alongside the electrocardiogram and phonocardiogram.
Phases of the Cardiac Cycle
The cardiac cycle can be broken down into four primary phases based on pressure and volume changes:
1. Isovolumic Contraction Time (IVCT)
IVCT is a sub-phase of systole. It is the period between the closure of the Mitral Valve (MV) and the opening of the Aortic Valve (AV). During this time, the ventricles are contracting, but because all valves are closed, the volume remains the same (Iso = same, Volumic = volume).
Heart Sound: The closure of the MV/TV during this phase produces the first heart sound (S1).
2. Ventricular Systole
This is the period where the ventricles eject blood into the system.
Mechanism: Systole begins when Left Ventricular (LV) pressure exceeds aortic pressure, forcing the AV valve open.
Volume: Ventricular volume rapidly decreases as blood is pumped out, while atrial volume slowly increases as they receive blood from the veins.
3. Isovolumic Relaxation Time (IVRT)
IVRT is a sub-phase of diastole. It occurs after the AV valve closes but before the MV opens.
Mechanism: Ventricular pressure is falling rapidly, but all valves are closed, so volume remains constant.
Heart Sound: The closure of the AV/PV valves produces the second heart sound (S2).
4. Diastole (Ventricular Filling)
Diastole is the period when the MV/TV are open and blood moves from the atria into the ventricles. It consists of three distinct stages:
Early Filling (Rapid Filling): Once LV pressure falls below atrial pressure, the MV opens. The expanding LV "sucks" blood from the LA; this phase accounts for approximately 70% of LV filling.
Diastasis: A period of slow filling where pressures between the LV and LA are roughly equal, and the MV may "hang" in a semi-open position.
Late Filling (Atrial Kick): The atria depolarize and contract, pushing the final 30% of blood into the ventricles.
Electrocardiogram (ECG) Correlation
An ECG records the electrical activity of the heart. In clinical echo settings, a 3-lead ECG is often used, following "Einthoven's Triangle". A common mnemonic for electrode placement is "White on right, smoke over fire".
The ECG waveform consists of three main components that correspond to the cardiac cycle:
P Wave: Represents atrial depolarization, which leads to atrial contraction (the "atrial kick").
QRS Complex: Represents ventricular depolarization, leading to ventricular contraction. This marks the start of systole.
T Wave: Represents ventricular repolarization, leading to ventricular relaxation. This marks the end of systole and the start of diastole.
Exam Tip: Timing Systole and Diastole on an ECG
To identify the phases of the cycle using an ECG tracing:
Systole: Occurs from the beginning of the QRS complex to the end of the T wave.
Diastole: Occurs from the end of the T wave to the beginning of the next QRS complex.
Keep reading for free.
Create an account to finish this reading and make it part of your study routine.