The Accounting Cycle and Financial Statements: A Guide to Financial Health
This guide explains the accounting cycle, including double-entry bookkeeping, journals, ledgers, and trial balances. It details the three primary financial statements: the balance sheet, income statement, and statement of cash flows, and discusses asset classification by liquidity.
In the world of business, information is power. For managers, investors, and government agencies, understanding a company's financial health is essential for making informed decisions. This understanding is made possible through accounting—the systematic process of recording, classifying, summarizing, and interpreting financial transactions and events. To navigate this field, one must understand the structured process known as the accounting cycle and the resulting financial statements that serve as a company's "report card."
The Accounting Cycle
The accounting cycle is a systematic process used to classify, summarize, and interpret financial data to inform management decision-making. While modern technology and accounting software have significantly simplified these steps, the underlying logic remains the same.
The foundation of this cycle is double-entry bookkeeping. This concept dictates that every single business transaction affects at least two different accounts, ensuring that the accounting equation remains in balance.
The cycle typically moves through several key stages:
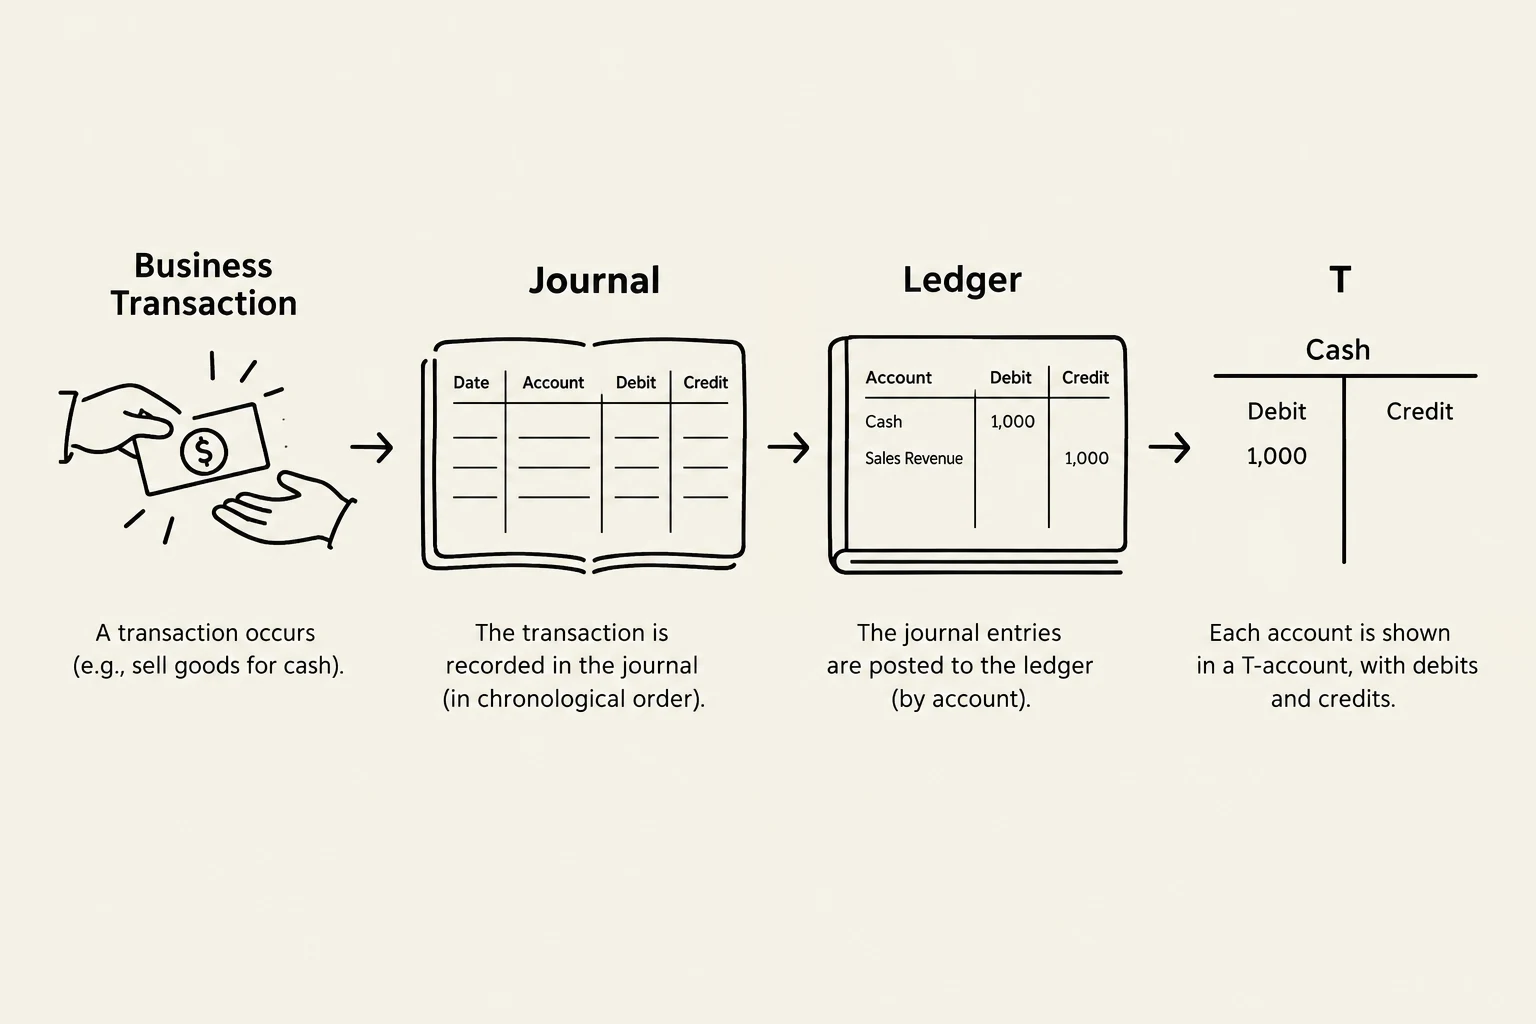
The Journal: This is the initial record book where all accounting data are first entered chronologically.
The Ledger: Once recorded in the journal, information is moved to the ledger. This is a specialized book where data is accumulated into specific accounts, allowing managers to view all information regarding a single account (like "Cash" or "Inventory") in one place.
The Trial Balance: To ensure accuracy, accountants prepare a trial balance. This is a summary of all data in the account ledgers used to verify that the total debits equal the total credits and that the figures are balanced.
This diagram illustrates the accounting process, starting from a business transaction, its recording in a journal, posting to a ledger, and finally representation in a T-account format.
Exam Tip: Remember that the primary purpose of the Trial Balance is to check for mathematical accuracy between debits and credits. It does not necessarily prove that all transactions were recorded correctly or that no errors of omission occurred.
The Financial Statements
The ultimate output of the accounting cycle is the production of financial statements. These are summaries of all transactions that occurred over a specific period, providing a snapshot of a firm's financial health and stability. There are three primary statements that every stakeholder looks for:
1. The Balance Sheet (Statement of Financial Position)
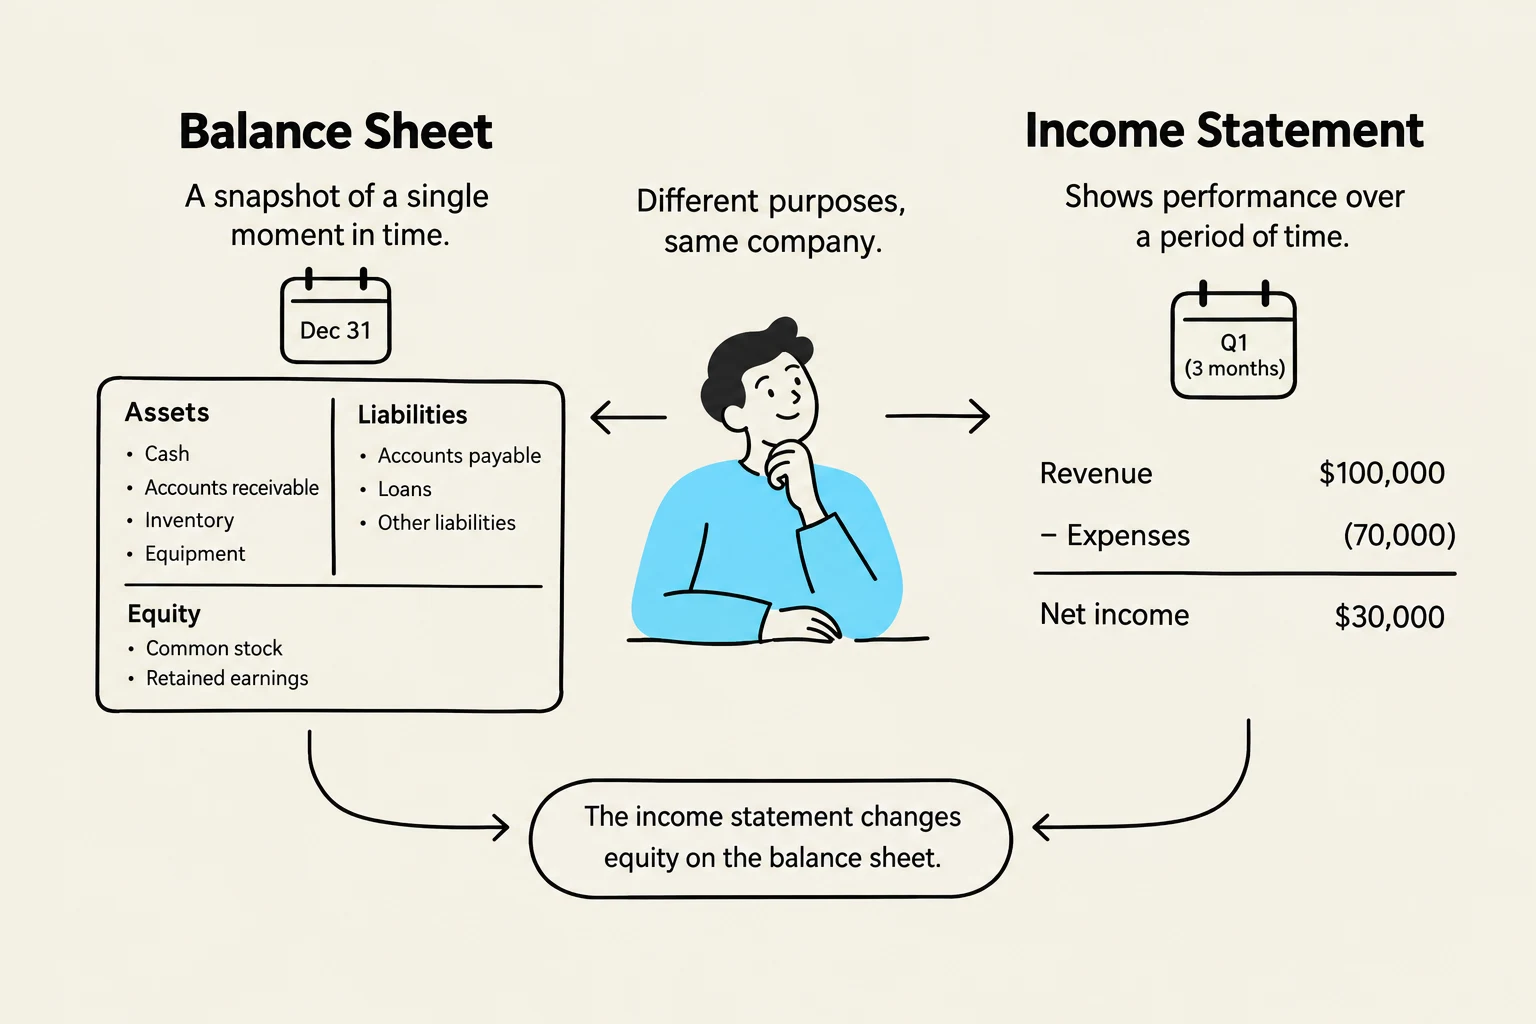
The balance sheet reports a firm's financial position at a specific point in time, usually at the end of a reporting period. It is built upon the fundamental accounting equation:
Assets=Liabilities+Owners’ Equity
Assets: Economic resources owned by a firm.
Liabilities: What the business owes to others, such as debts or accounts payable.
Owners' Equity: The residual interest in the assets after deducting liabilities. It represents the total amount invested by owners plus accumulated profits that have not yet been paid out.
2. The Income Statement (Statement of Revenues and Expenses)
While the balance sheet is a "snapshot" of a single moment, the income statement summarizes activity over a specific period of time. It highlights the total profit or loss (the "bottom line") by calculating:
Net Profit/Loss=Revenue−Cost of Goods Sold−Operating Expenses−Taxes
3. The Statement of Cash Flows (Statement of Cash Receipts and Disbursements)
This statement tracks the actual movement of money into and out of the firm. It is crucial because a company can be profitable on an income statement but still run out of cash. It categorizes cash movements into three activities: operations, investing, and financing.
This illustration explains the difference between a balance sheet, which shows a company's financial position at a specific point in time, and an income statement, which shows its financial performance over a period. It also illustrates how the income statement affects equity on the balance sheet.
Deep Dive: Understanding Assets and Liquidity
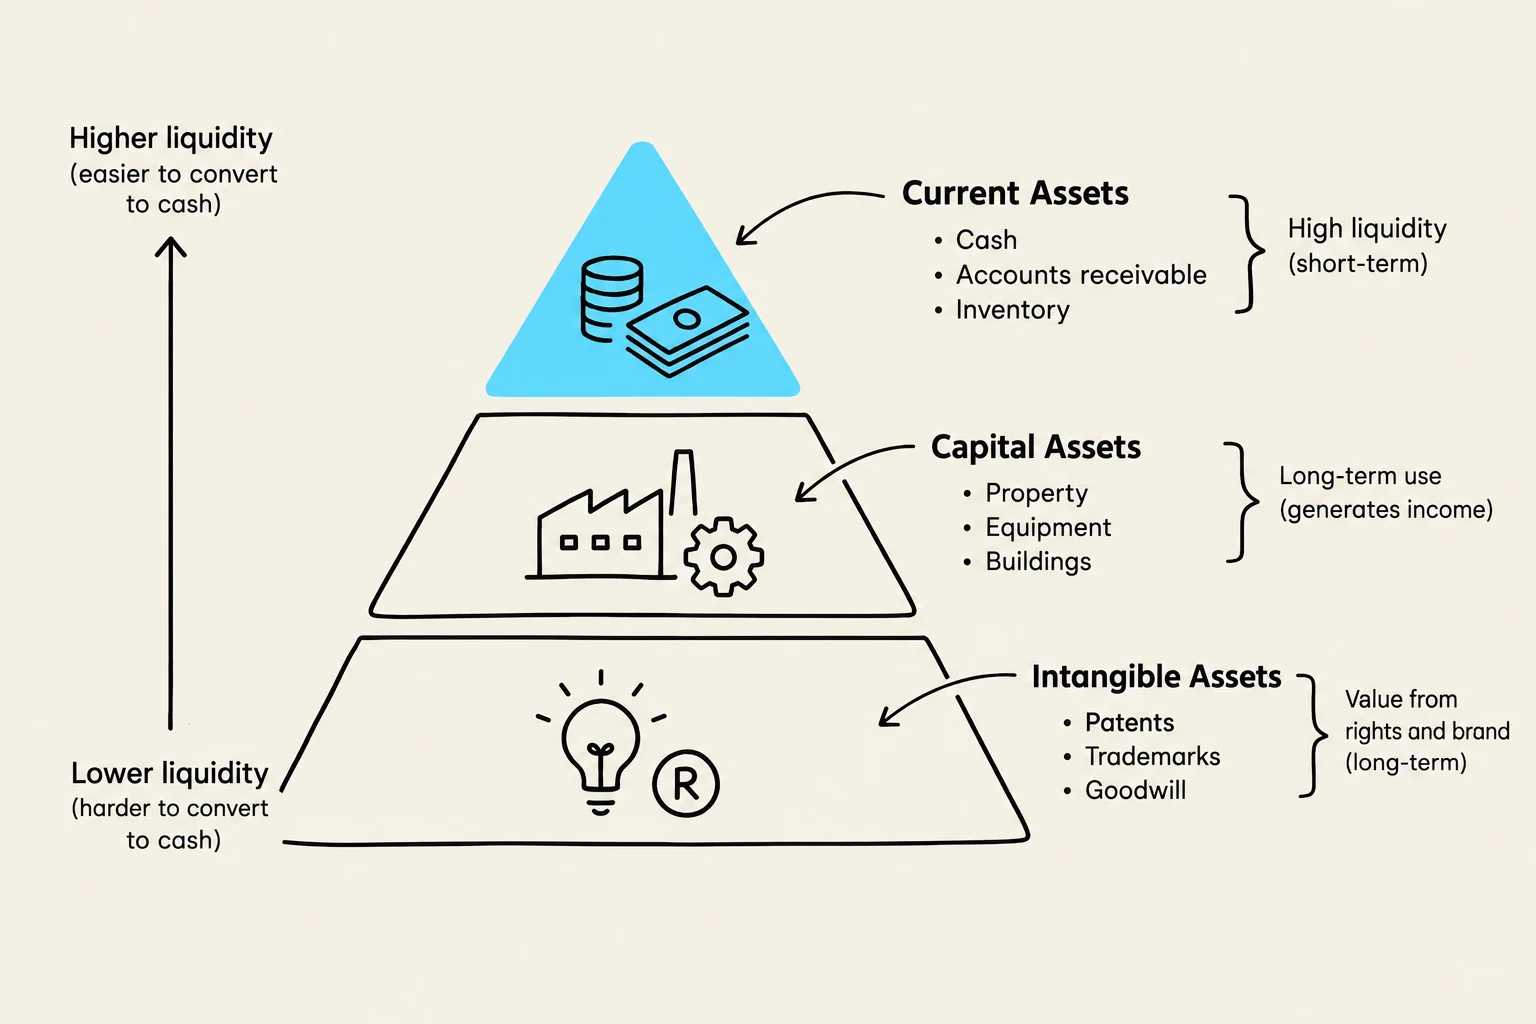
On a balance sheet, assets are not listed randomly. They are organized according to their liquidity, which refers to how quickly an asset can be converted into cash. Assets are generally categorized into three types:
Current Assets: Items expected to be converted into cash within one year. Common examples include cash, accounts receivable (money owed by customers), and inventory.
Capital Assets (Fixed Assets): Relatively permanent, tangible goods acquired to produce products, such as land, buildings, and equipment.
Intangible Assets: Long-term assets that have no physical form but hold significant value, such as patents, trademarks, and copyrights.
This diagram illustrates the classification of assets based on their liquidity and long-term value, categorizing them into Current Assets, Capital Assets, and Intangible Assets.
Summary Table: Key Financial Terms
Term
Definition
Key Component/Example
Revenue
Value received for goods/services
Sales, Rent received
Liabilities
Debts owed to others
Accounts payable, Notes payable
Operating Expenses
Costs of running the business
Rent, Salaries, Utilities
Gross Profit
Revenue minus Cost of Goods Sold
Net Sales−COGS
By mastering the accounting cycle and understanding these statements, you gain the ability to perform ratio analysis—using these figures to calculate metrics like liquidity, leverage, and profitability to judge a company's true performance.
Keep reading for free.
Create an account to finish this reading and make it part of your study routine.