This content explains tax incidence, distinguishing between statutory and economic burdens, and how relative price elasticity of supply and demand determines the distribution of the tax burden between buyers and sellers.
When governments intervene in a market through taxes, the immediate reaction is often to look at who is legally required to write the check to the tax authorities. However, in economics, the person who physically hands over the money to the government is not necessarily the person who suffers the most from the tax. To understand how a tax actually affects a market, we must distinguish between who is legally responsible for the tax and who actually feels the financial sting.
Statutory vs. Economic Burden
To analyze taxes effectively, we must first define two distinct concepts: statutory burden and economic burden.
Statutory Burden: This is the legal obligation assigned by the government. If a law states that a soda company must pay $0.15 per ounce of soda sold, the statutory burden falls on the seller.
Economic Burden: This is the actual change in the after-tax prices faced by buyers and sellers. It represents the real "cost" of the tax to each party.
Tax Incidence: This refers to the final division of the economic burden between the buyer and the seller.
A common misconception is that the statutory burden determines the tax incidence. In reality, the tax incidence does not depend on whether the government levies the tax on the buyer or the seller; the end result for the market is exactly the same.
How Taxes Shift the Market
Whether a tax is placed on a buyer or a seller, it changes the market equilibrium—the point where the supply and demand curves intersect.
A Tax on Sellers
When a tax is imposed on sellers, it is viewed as an increase in the marginal cost of production. Because the supply curve represents the marginal cost, a tax causes the supply curve to shift "up" or to the left by the amount of the tax.
This graph illustrates the economic concept of supply and demand, showing how a shift in supply affects the equilibrium price and quantity of soda.
After the shift, a new equilibrium is established. At this point, the price buyers pay is higher than the original price, and the price sellers receive (after paying the tax to the government) is lower than the original price.
A Tax on Buyers
Conversely, if the government imposes a tax on buyers, it reduces the marginal benefit of consuming the good. Since the demand curve represents the marginal benefit, the tax causes the demand curve to shift "down" or to the left.
This graph illustrates the economic concept of demand and supply, showing how a shift in demand affects the equilibrium price and quantity of soda.
Even though the legal responsibility has shifted to the consumer, the resulting equilibrium price and quantity will be identical to the "tax on sellers" scenario.
The Role of Price Elasticity
The most critical factor in determining tax incidence is relative price elasticity. Elasticity measures how responsive buyers or sellers are to changes in price.
Inelasticity: If a party is inelastic, they are relatively unresponsive to price changes (the curve is steeper).
Elasticity: If a party is elastic, they are highly responsive to price changes (the curve is flatter).
The golden rule of tax incidence is: The more inelastic party bears more of the tax burden.
Scenario 1: Inelastic Demand
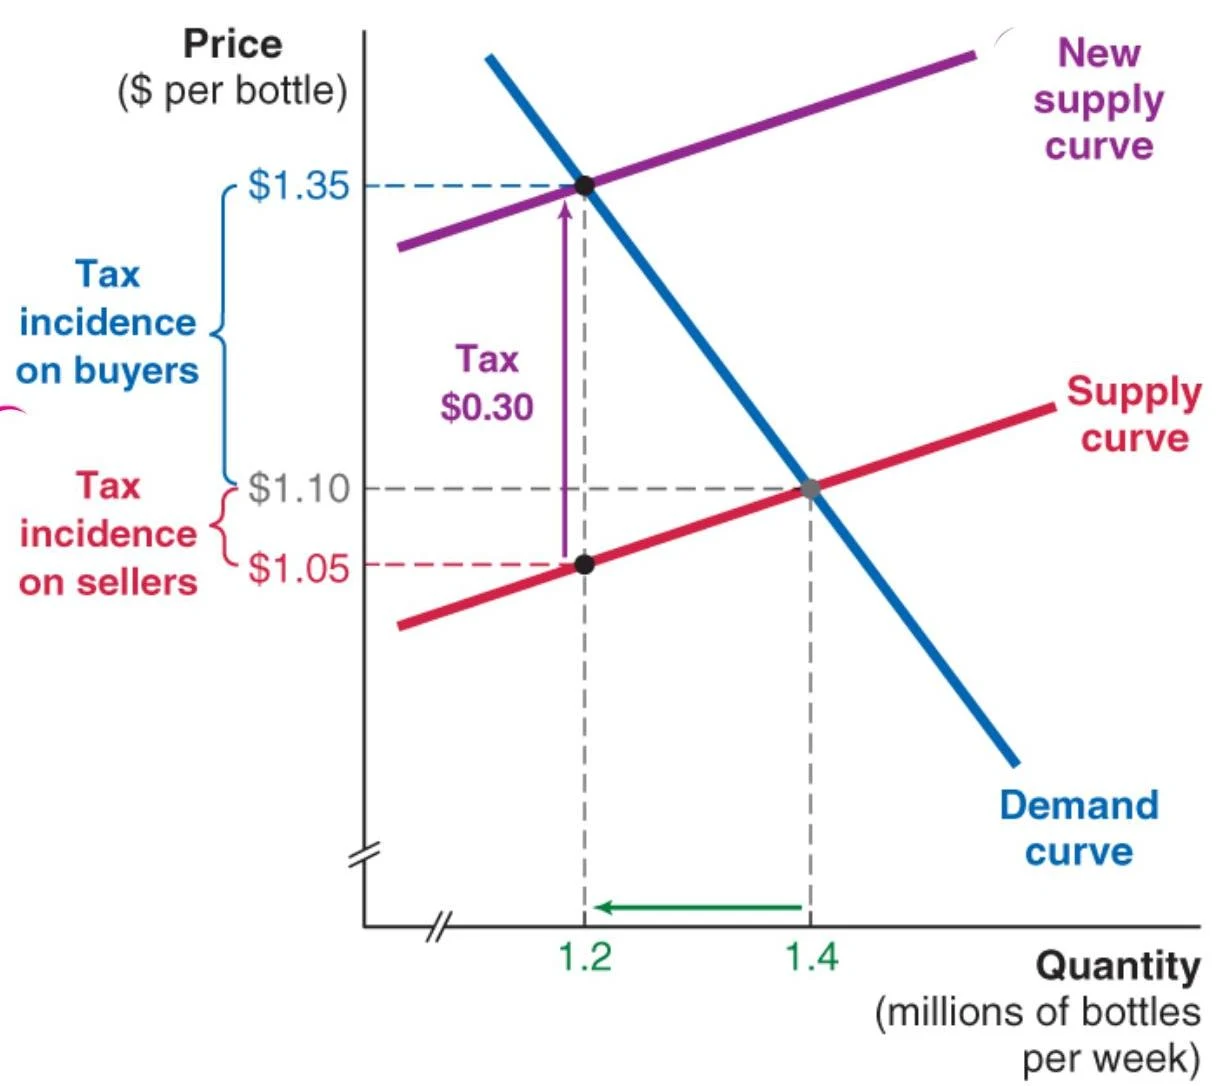
If consumers need a product urgently (like gasoline or certain medicines) and cannot easily switch to substitutes, they have inelastic demand. In this case, when a tax is applied, sellers can pass most of the cost onto the buyers through higher prices.
This graph illustrates the economic concept of tax incidence, showing how a tax on a good affects both buyers and sellers. The original supply curve is red, and the demand curve is blue. After a tax is imposed, the supply curve shifts to the purple line, resulting in a higher price for buyers ($1.35) and a lower price received by sellers ($1.05), with the difference representing the tax burden.
In the example above, if demand is very steep (inelastic), the buyer's share of the tax might rise to 83.3%, while the seller only bears 16.7%.
Scenario 2: Elastic Demand
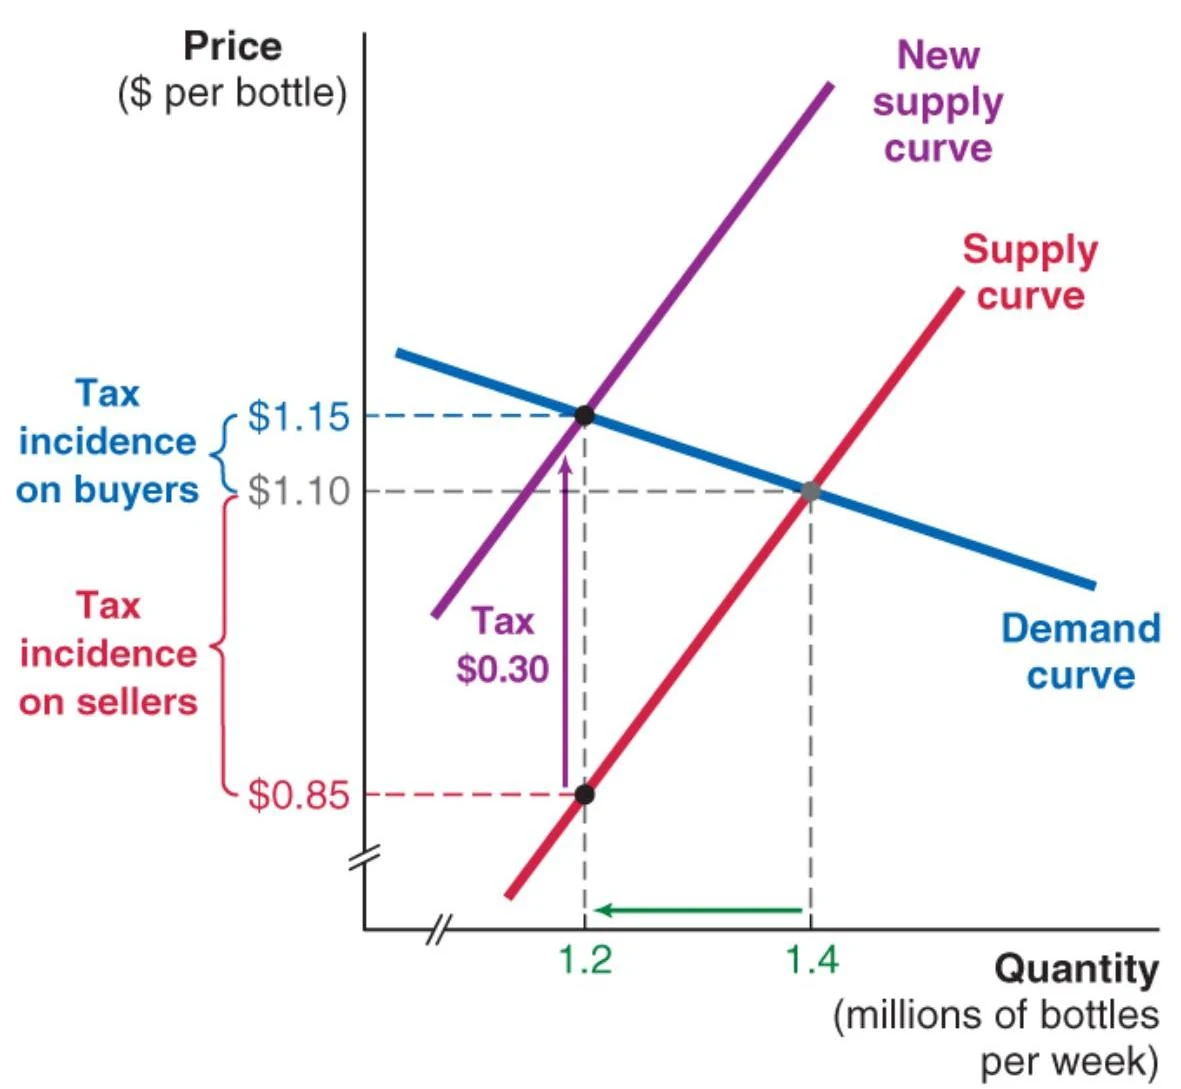
If consumers are very sensitive to price changes (they have many substitutes), they have elastic demand. If a tax is imposed, consumers will simply stop buying the product if the price rises too much. To keep selling, the sellers must absorb most of the tax themselves.
This graph illustrates the economic impact of a tax on a market, showing how it shifts the supply curve and affects prices and quantities for buyers and sellers.
In this case, the buyer's share might drop to only 16.7%, leaving the seller to bear 83.3% of the burden.
Exam Tip: The Four-Step Recipe for Evaluating Taxes
Identify the shift: Which curve is shifting (supply or demand)?
Determine direction: Is it an increase (shift right/up) or a decrease (shift left/down)?
Find the new equilibrium: Compare the pre-tax and post-tax prices and quantities.
Determine incidence: Who is more inelastic? That party bears more of the burden.
Summary Table: Tax Incidence and Elasticity
If...
The more inelastic party is...
The tax burden falls mostly on...
Demand is steeper than Supply
Buyers
Buyers
Supply is steeper than Demand
Sellers
Sellers
By understanding these relationships, policymakers can better predict whether a tax intended to discourage behavior (like a soda tax) will actually result in higher prices for consumers or lower profits for producers.
Keep reading for free.
Create an account to finish this reading and make it part of your study routine.