Explore the fundamental economic principles of supply and demand, how they interact to determine market equilibrium, and the concepts of surpluses and shortages.
In a competitive market—one with many buyers and sellers of the same good or service where no single participant can influence the price—the forces of supply and demand interact to determine the price and quantity of goods traded. Understanding how these two forces balance each other is fundamental to grasping how modern economies function.
The Building Blocks: Demand and Supply
To understand equilibrium, we must first define the two curves that drive market behavior: the demand curve and the supply curve.
The Demand Curve
Demand represents the behavior of buyers. A demand curve shows the quantity demanded at various prices. The "quantity demanded" is specifically the amount that buyers are willing and able to purchase at a particular price.
According to the Law of Demand, a higher price for a good or service leads people to demand a smaller quantity. This creates a downward-sloping curve: as the price falls, the quantity demanded rises.
A demand curve illustrates the inverse relationship between price and quantity demanded, showing that as price decreases, quantity demanded increases, and vice versa.
The Supply Curve
Supply represents the behavior of sellers. A supply curve shows the quantity supplied at various prices. The "quantity supplied" is the amount that producers are willing and able to sell at a specific price.
Unlike demand, the supply curve is upward-sloping. As the price of a good rises, the quantity supplied also rises.
Market Equilibrium
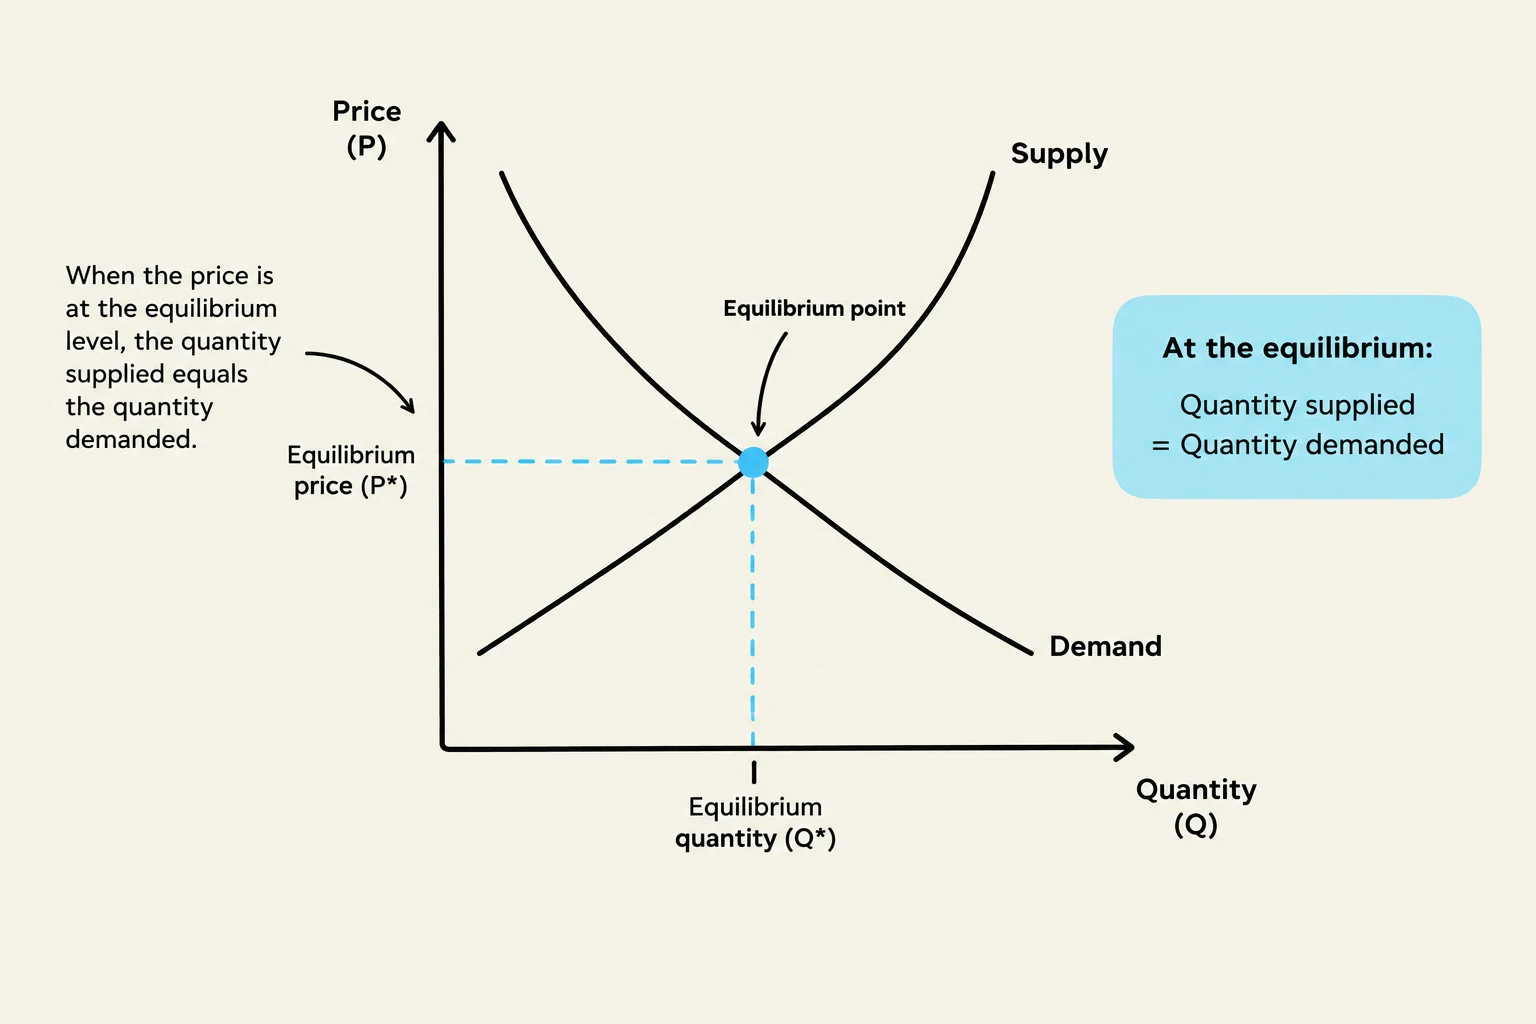
Market equilibrium occurs when the quantity supplied (Qs) equals the quantity demanded (Qd) at a specific price. At this point, the amount consumers want to buy is matched exactly by the amount producers want to sell.
This graph illustrates the economic concept of market equilibrium, where the quantity of a good supplied equals the quantity demanded at a specific price and quantity.
When these curves intersect, we identify two critical values:
Equilibrium Price: The unique price at which the market clears.
Equilibrium Quantity: The specific amount of the good exchanged at the equilibrium price.
Exam Tip: Don't confuse a "change in demand" with a "change in quantity demanded." A change in quantity demanded is a movement along the existing curve caused by a price change. A change in demand is a shift of the entire curve caused by outside factors.
Imbalances: Surpluses and Shortages
Markets do not always stay in equilibrium. If the market price is not at the equilibrium level, one of two imbalances will occur:
Surplus
A surplus occurs when the quantity supplied exceeds the quantity demanded (Qs>Qd). This typically happens when the market price is set above the equilibrium level. Because sellers have excess goods sitting on shelves, they will eventually reduce prices to move their inventory, naturally pushing the market back toward equilibrium.
Shortage
A shortage occurs when the quantity demanded exceeds the quantity supplied (Qd>Qs). This happens when the price is below the equilibrium level. In this scenario, because there is more demand than available goods, sellers will increase prices to maximize revenue, which also moves the market back toward equilibrium.
Shifting the Curves
While price changes cause movement along the curves, other factors can cause the entire curves to shift.
Demand Curve Shifts
A shift in demand means that at every price point, consumers now want to buy more (rightward shift) or less (leftward shift) of the good. Key demand shifters include:
Prices of related goods: Substitutes (if the price of a substitute falls, demand for the original good decreases) and complements (if the price of a complement falls, demand for the original good increases).
Income: For "normal goods," an increase in income increases demand; for "inferior goods," an increase in income decreases demand.
Tastes and preferences: Subjective changes in what consumers like.
Expectations: Anticipating future price changes.
Number of consumers: More buyers in the market increase demand.
Supply Curve Shifts
A shift in supply occurs when the entire relationship between price and quantity supplied changes.
An increase in supply is a rightward shift.
A decrease in supply is a leftward shift.
Key supply shifters include changes in input prices (e.g., raw materials), technology (innovations that lower costs), expectations of future prices, and the number of producers in the market.
Measuring Economic Benefit: Surplus
In a market, the equilibrium price creates value for both sides of the transaction.
Consumer Surplus: This is the benefit gained by consumers who were willing to pay more than the equilibrium price. For example, if you were willing to pay $30 for a product but only had to pay the equilibrium price of $20, your consumer surplus is $10.
Producer Surplus: This is the benefit gained by producers who were willing to sell at a price lower than the equilibrium price. If a producer was willing to sell a good for $15 but receives the equilibrium price of $20, they earn a producer surplus of $5.
By analyzing these surpluses alongside shifts in supply and demand, economists can predict how changes in the world—from new technology to changing consumer tastes—will impact the prices we pay and the goods we consume.
Keep reading for free.
Create an account to finish this reading and make it part of your study routine.