


Statistical analysis in R requires a structured approach, moving from data cleaning and descriptive summaries to complex multivariate modeling. By leveraging the "Tidyverse" ecosystem alongside specialized packages like psych, sjPlot, and afex, researchers can perform a seamless workflow of data exploration, factor extraction, and hypothesis testing. This article explores the implementation of these methods using real-world data structures.
Data Exploration and Summarization
Before conducting advanced modeling, it is essential to understand the distribution, central tendency, and relationships within your dataset. The tidyverse package provides the foundational tools for data manipulation, while summarytools offers a high-level overview of variable characteristics.
Using the dfSummary() function from summarytools, researchers can quickly generate a comprehensive table containing means, standard deviations, minimum/maximum values, and frequency distributions. This step is crucial for identifying missing values or potential outliers that might skew subsequent analyses.
To examine the relationships between continuous variables, the Pearson-method correlation is frequently employed. This method calculates the linear correlation coefficient between two variables, providing a measure of how closely they move together.
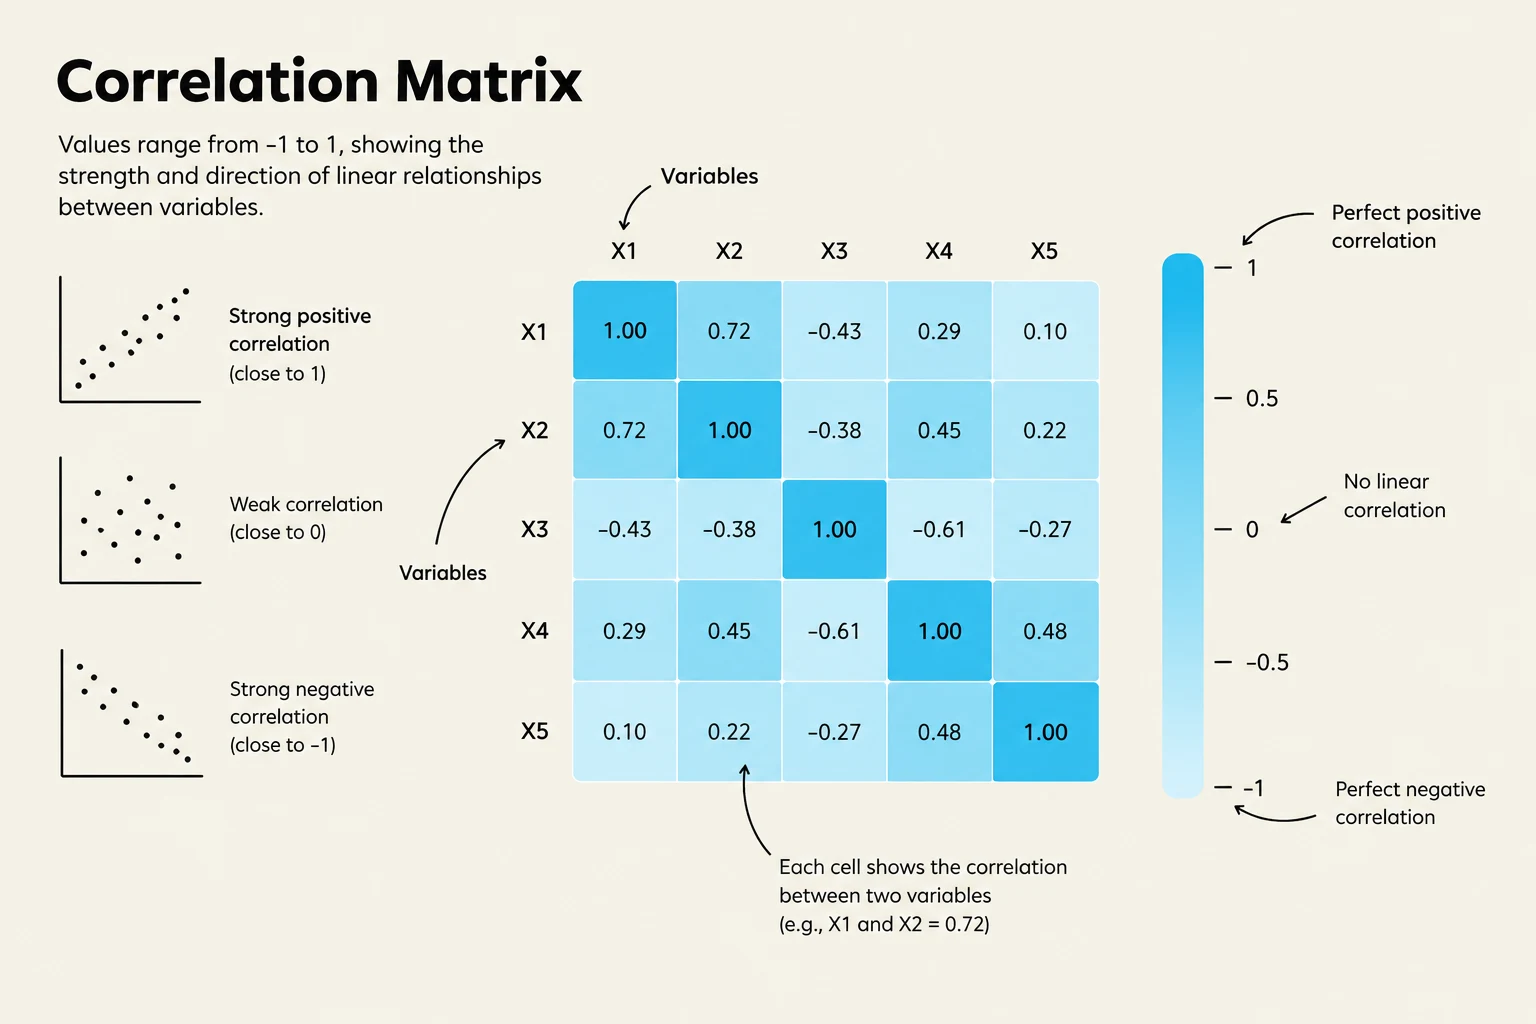
Exam Tip: When reporting correlations, always check the -value. A high correlation coefficient is only meaningful if it is statistically significant (e.g., ).
Dimensionality Reduction: Factor Analysis
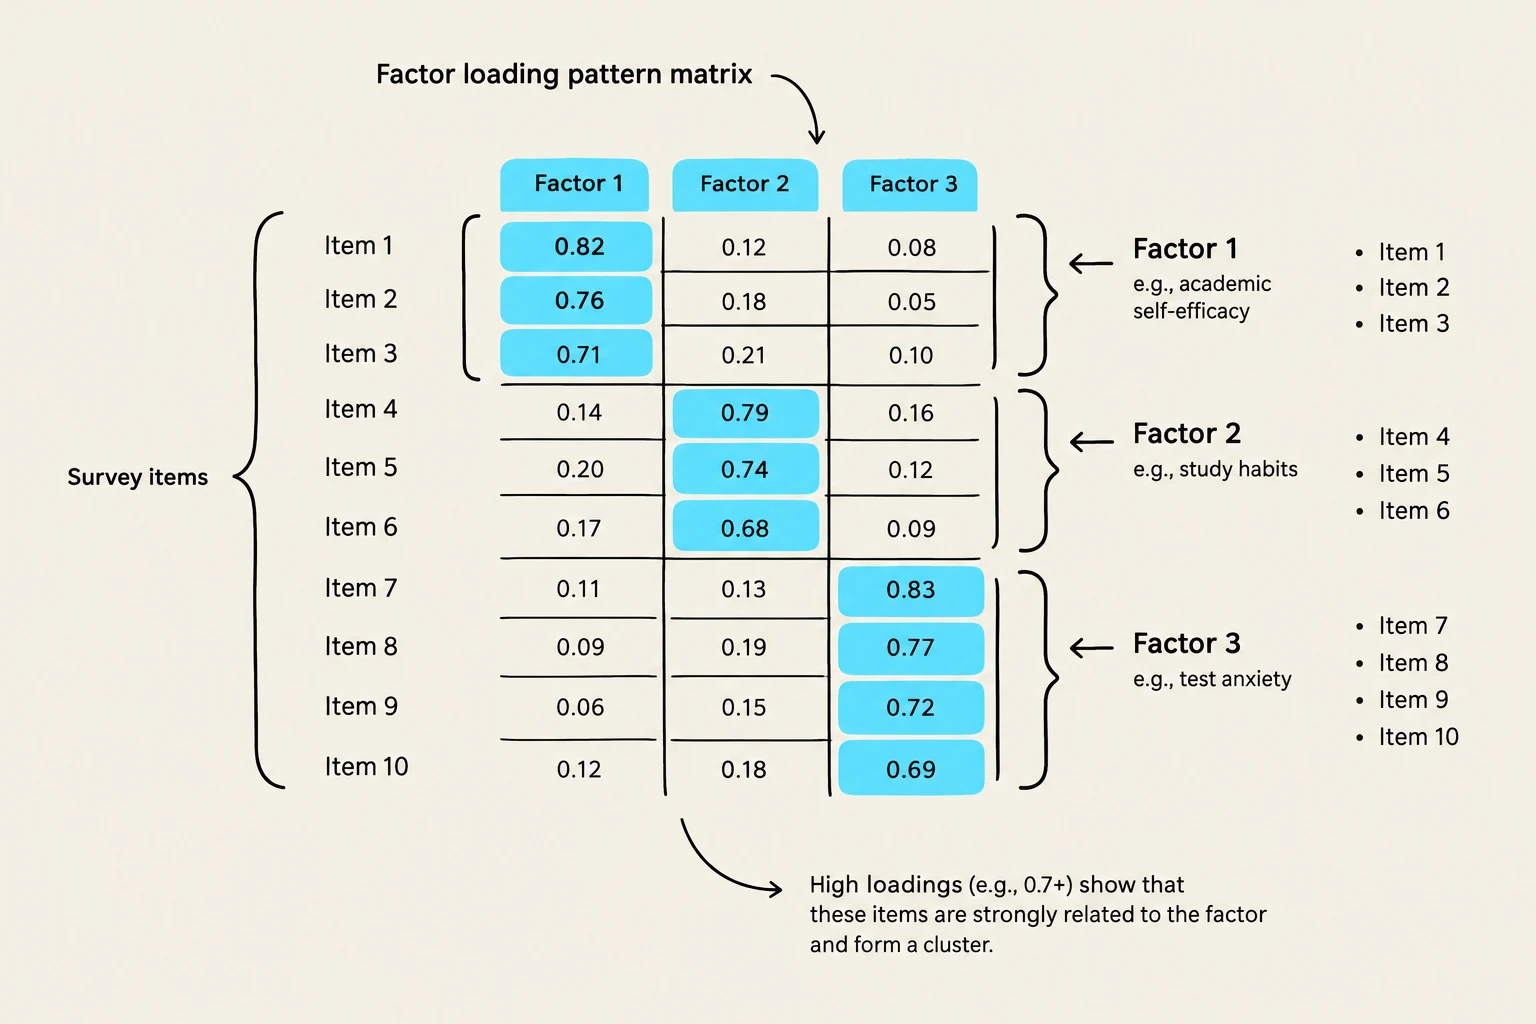
When dealing with many related survey items, Factor Analysis (FA) is used to identify underlying latent constructs that explain the patterns of correlations among observed variables.
Keep reading for free.
Create an account to finish this reading and make it part of your study routine.
Continue reading freeAlready have an account? Log in
Updated