Learn the principles of spectrophotometry, including how to determine an absorption spectrum and construct a standard curve to measure unknown concentrations of dissolved chemicals.
In the field of analytical chemistry and biology, being able to identify a substance and determine exactly how much of it is present in a solution is a fundamental skill. One of the most versatile and precise techniques used for these purposes—ranging from analyzing blood chemistry to monitoring pollutants in lake water—is spectrophotometry. This method relies on the unique way that different atoms, molecules, or chemical bonds interact with light. By measuring how much light a substance absorbs, scientists can unlock both the identity and the concentration of a dissolved chemical.
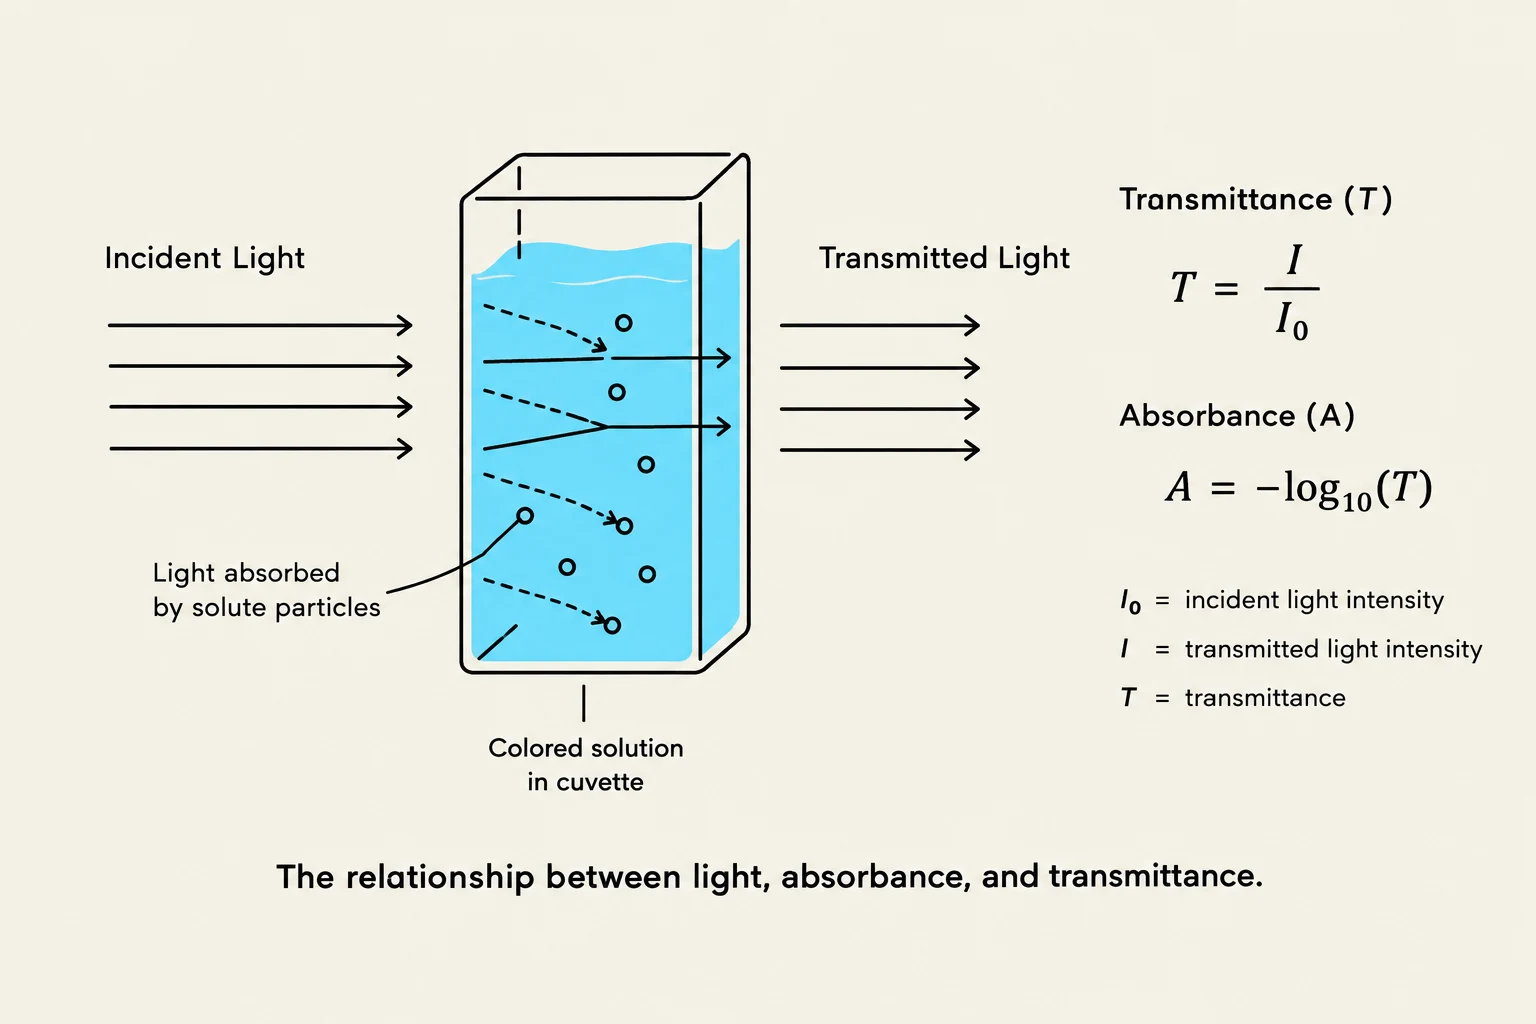
The relationship between light, absorbance, and transmittance, illustrated with a diagram showing incident light passing through a colored solution in a cuvette and the resulting transmitted light, along with the relevant mathematical formulas.
The Principles of Spectrophotometry
At the heart of this technique is the spectrophotometer, an instrument designed to measure the amount of light absorbed and transmitted by a dissolved chemical.
How Light Interacts with Matter
When white light (which is a combination of all visible wavelengths) passes through a solution, the dissolved solutes interact with the light. Some wavelengths are absorbed by the chemical, while others are transmitted through the solution and exit the other side.
Every chemical has a unique "fingerprint" of wavelengths that it absorbs or reflects. For example, a nitrogenous base like cytosine will absorb a different pattern of light than adenine. This allows researchers to identify specific substances based on their unique absorption spectrum—a graph that relates absorbance to wavelength.
Absorbance vs. Transmittance
A spectrophotometer typically provides two different ways to view this data:
Transmittance: This is the amount of light that passes through the sample. It is calculated as the intensity of light exiting the sample divided by the amount of light entering it.
Absorbance: This is the amount of radiation retained by the sample.
While transmittance is often expressed as a percentage, absorbance is a logarithmic function of transmittance and has no units. The relationship between these two is defined by the Beer-Lambert Law.
Exam Tip: The Direct Relationship
Unlike transmittance, absorbance has a directly proportional relationship with concentration. This means that if you double the concentration of a solute in a solution, the absorbance will also twofold increase. This mathematical convenience is what makes spectrophotometry so powerful for measuring unknown samples.
Step 1: Determining the Absorption Spectrum
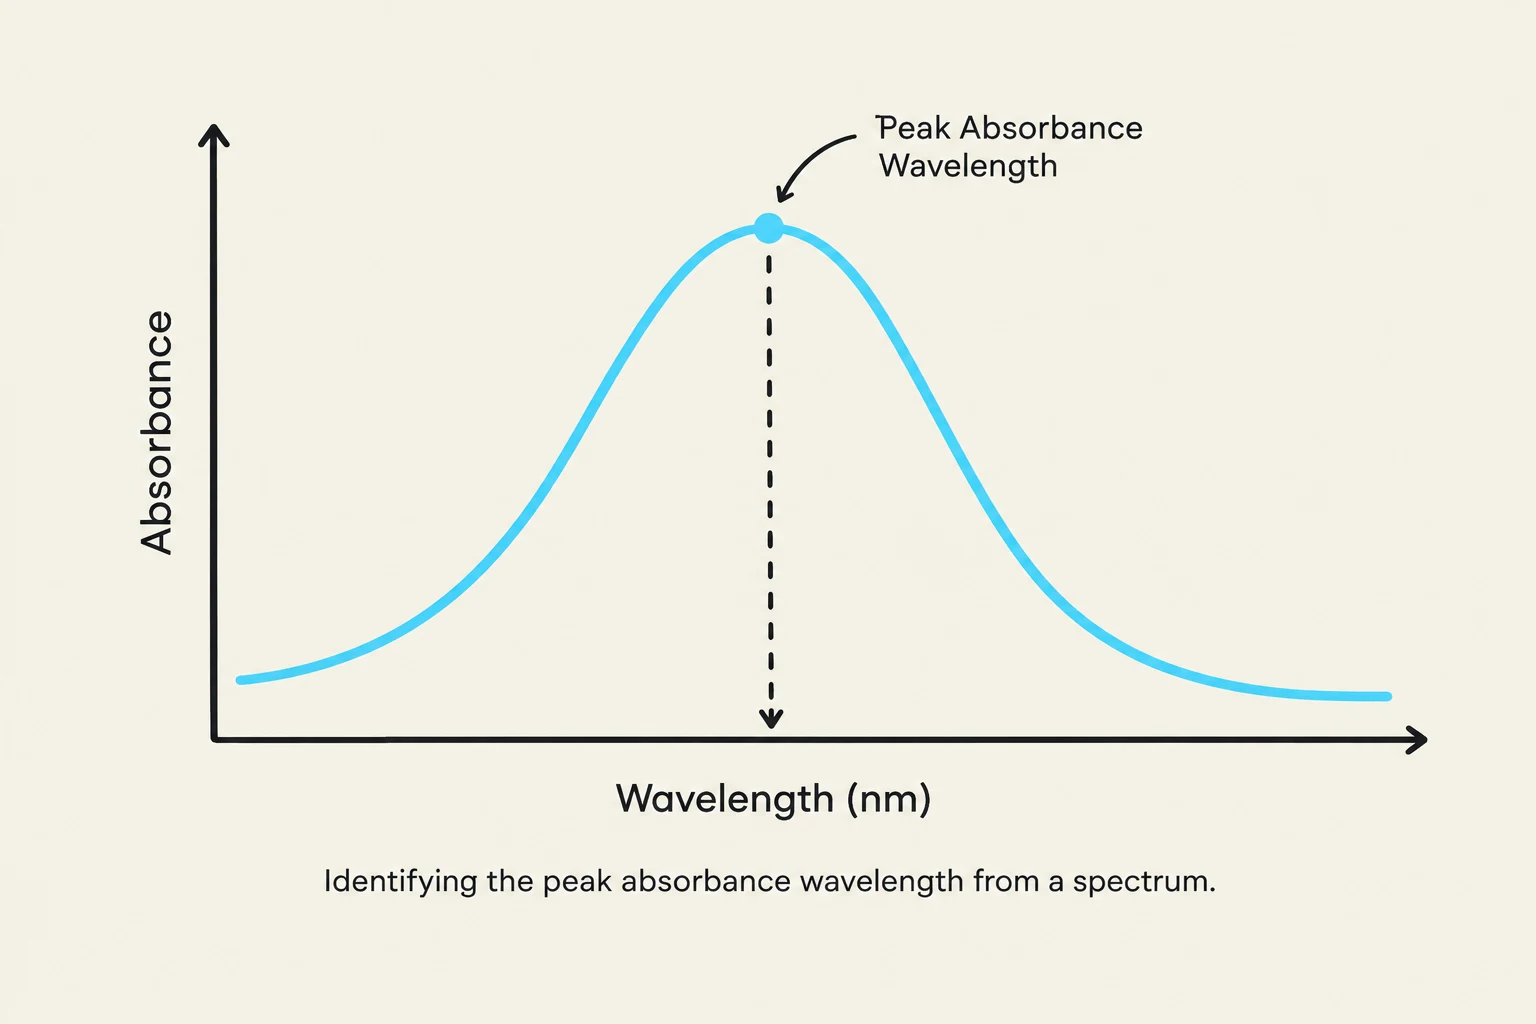
Identifying the peak absorbance wavelength from a spectrum.
Before you can measure an unknown concentration, you must first find the specific wavelength at which your chemical absorbs light most efficiently. This is known as the peak absorbance.
Using a Blank for Calibration
To ensure accuracy, you must first calibrate the machine using a blank. A blank is a sample containing only the solvent used to dissolve the chemical (most commonly distilled water). By inserting the blank, you tell the spectrophotometer to "zero out" any light absorbed by the solvent itself, ensuring that any subsequent absorbance measured is due solely to the solute.
Finding the Peak
To find the absorption spectrum, you measure the absorbance of a known sample across a range of different wavelengths. For instance, in a lab setting using cobalt chloride (CoCl2), a researcher would:
Calibrate the machine to zero absorbance using a distilled water blank.
Measure the absorbance of the cobalt chloride solution at various wavelengths (e.g., 350 nm, 420 nm, etc.).
Plot these values on a graph of absorbance versus wavelength.
The highest point on this graph identifies the wavelength of peak absorbance, which is the optimal setting for all subsequent measurements.
Step 2: Constructing a Standard Curve
Once the peak wavelength is identified, the next step is to build a standard curve. This is a tool used to translate an absorbance reading into a precise concentration value.
Creating the Curve
To construct the curve, you prepare a series of standards—solutions that have known, varying concentrations of the solute. You then measure the absorbance of each standard specifically at the peak wavelength identified in Step 1.
The data is plotted on a graph with:
Concentration on the horizontal axis (x-axis).
Absorbance on the vertical axis (y-axis).
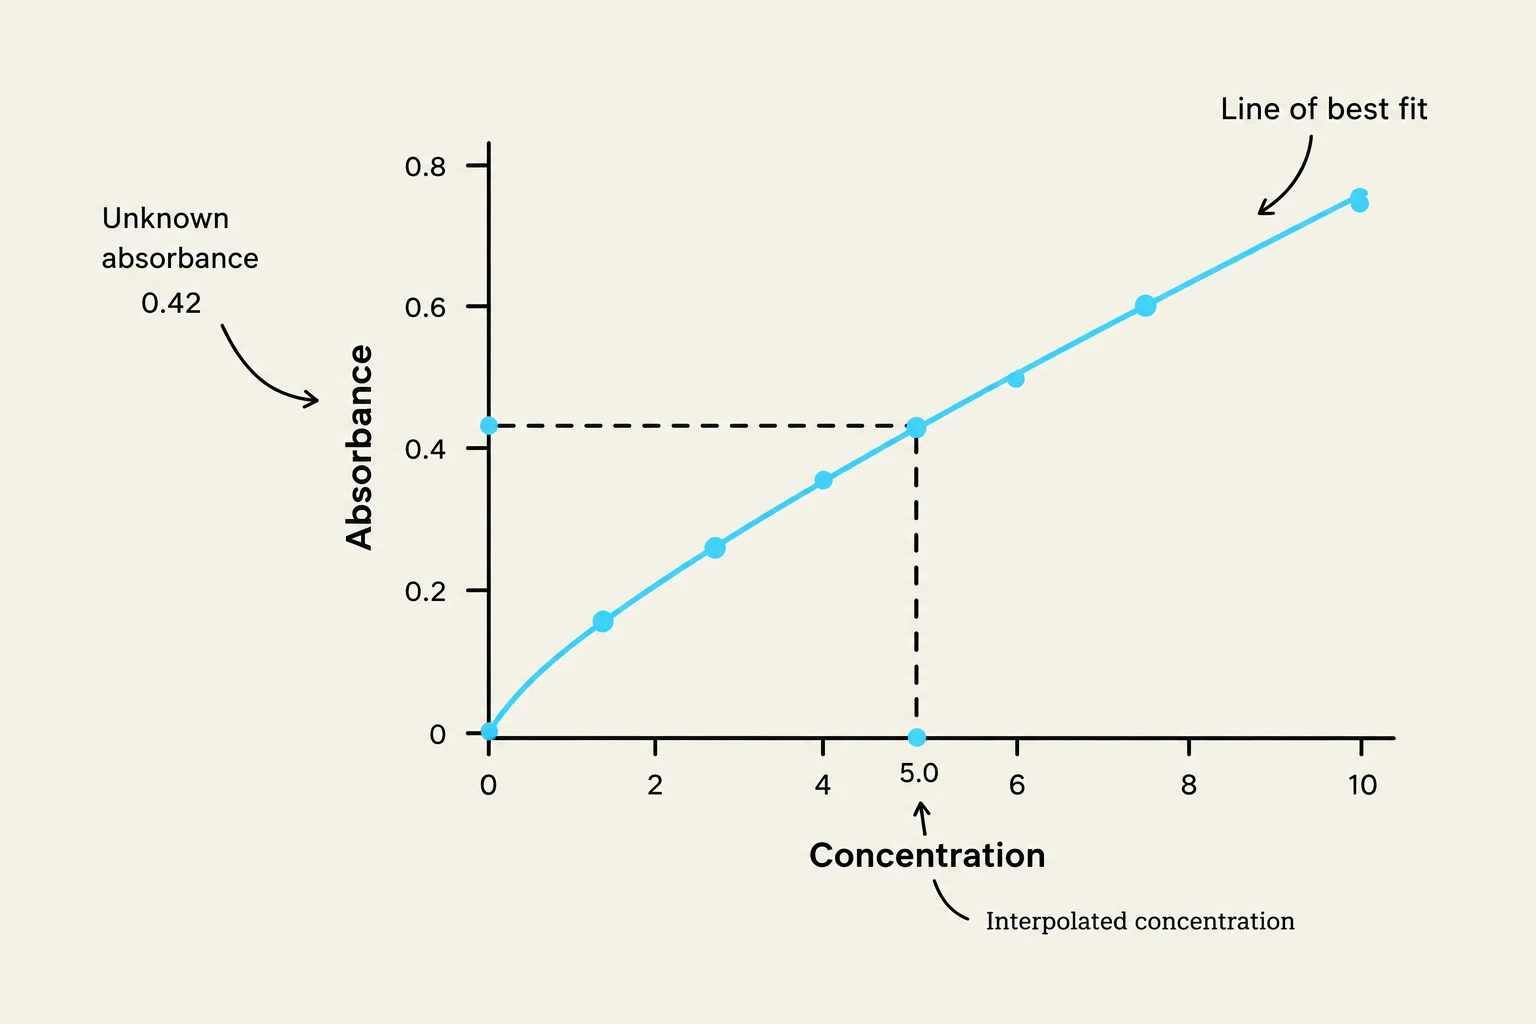
Because of the directly proportional relationship between absorbance and concentration, the data points should form a straight line. When graphing, you should draw a "line of best fit" that passes as close to all points as possible, rather than simply connecting the dots like a jagged mountain range.
Caution: Saturation Effects
While the relationship is typically linear, extremely high concentrations of a solute can lead to "saturation," where the relationship becomes non-linear. Always ensure your unknown sample falls within the concentration range of your standards to maintain accuracy.
Measuring an Unknown Concentration
A graph showing the relationship between concentration and absorbance, with a line of best fit and an interpolated concentration indicated.
With a completed standard curve, determining the concentration of an unknown solution becomes a simple process of interpolation:
Measure: Place the unknown solution in the spectrophotometer and measure its absorbance at the peak wavelength.
Locate: Find that absorbance value on the vertical (y) axis of your standard curve.
Interpolate: Move horizontally from that point until you hit your line of best fit, then move vertically down to the horizontal (x) axis.
Identify: The value on the x-axis is the concentration of your unknown.
By following these two systematic procedures—determining the absorption spectrum and building a standard curve—scientists can transform light measurements into precise chemical data.
Keep reading for free.
Create an account to finish this reading and make it part of your study routine.