This text explains the concepts of reliability and consistency in measurement, differentiating them from validity. It details measurement error, distinguishing between random and systematic error, and introduces methods for quantifying and assessing reliability, such as test-retest, inter-rater, and internal consistenc
In the world of research, the quality of your data depends entirely on the quality of your tools. If you are trying to measure a concept—such as intelligence, anxiety, or customer satisfaction—you need to know if your measurement tool is actually doing its job. Two of the most critical pillars of measurement quality are reliability and consistency. Without these, even the most brilliant research design will fail because the data collected will be nothing more than "noise."
Defining Reliability and Consistency
At its core, reliability refers to the stability and consistency of a measure. If a measurement tool is reliable, it should produce similar results under consistent conditions. Imagine you are using a bathroom scale to weigh yourself. If you step on the scale three times in one minute and it gives you three wildly different numbers, that scale is unreliable. A reliable scale, conversely, would give you the same number every time, provided nothing else about you has changed.
In social science research, reliability means that if we were to apply the same measurement to the same subject under the same conditions, we would get the same result. It is important to note that reliability is about the reproducibility of the score, not necessarily whether the score is "correct" in an absolute sense.
Exam Tip: Reliability is about consistency, whereas validity is about accuracy. A scale can be highly reliable (giving you the same weight every time) but completely invalid (if it is calibrated incorrectly and always shows you are 10 pounds lighter than you actually are).
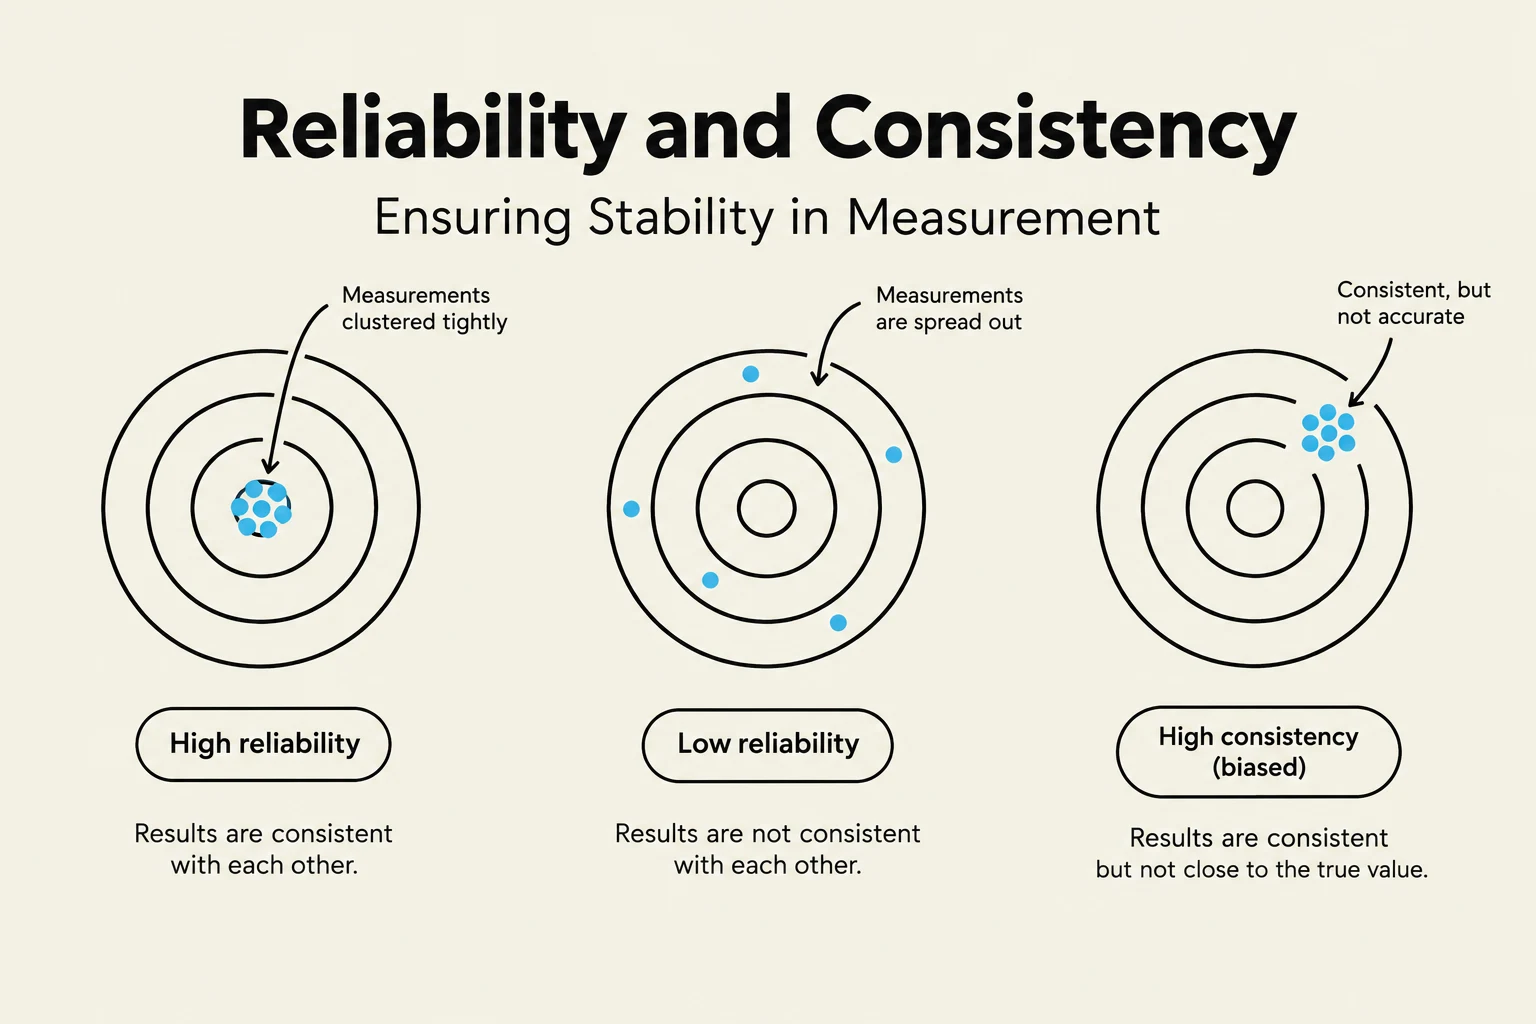
This diagram illustrates the concepts of reliability and consistency in measurement, showing examples of high reliability, low reliability, and high consistency with bias.
The Anatomy of Measurement Error
To understand why reliability fluctuates, we must look at the relationship between the "true score" and the "observed score." Every time we take a measurement, what we actually record is a combination of two distinct elements: the actual value we want to capture and the error that inevitably creeps in.
This relationship can be expressed through the classic measurement equation:
X=T+E
Where:
X is the Observed Score (the value you actually recorded).
T is the True Score (the actual value of the construct being measured).
E is the Measurement Error (the difference between the observed and true score).
Measurement error is the enemy of reliability. If the error component (E) is large and unpredictable, the observed score (X) will fluctuate wildly, leading to low reliability.
Random vs. Systematic Error
Not all errors are created equal. Researchers generally categorize error into two types:
Random Error: This is unpredictable noise. It might be caused by a participant being tired one day, a sudden loud noise in the room during an interview, or a slight misreading of a question. Random error decreases reliability because it makes results inconsistent.
Systematic Error: This is a consistent, predictable deviation in one direction. For example, if a survey question is worded in a way that always encourages people to answer "Yes," the error is systematic. While systematic error can ruin validity, it does not necessarily ruin reliability because the error is consistent every time the tool is used.
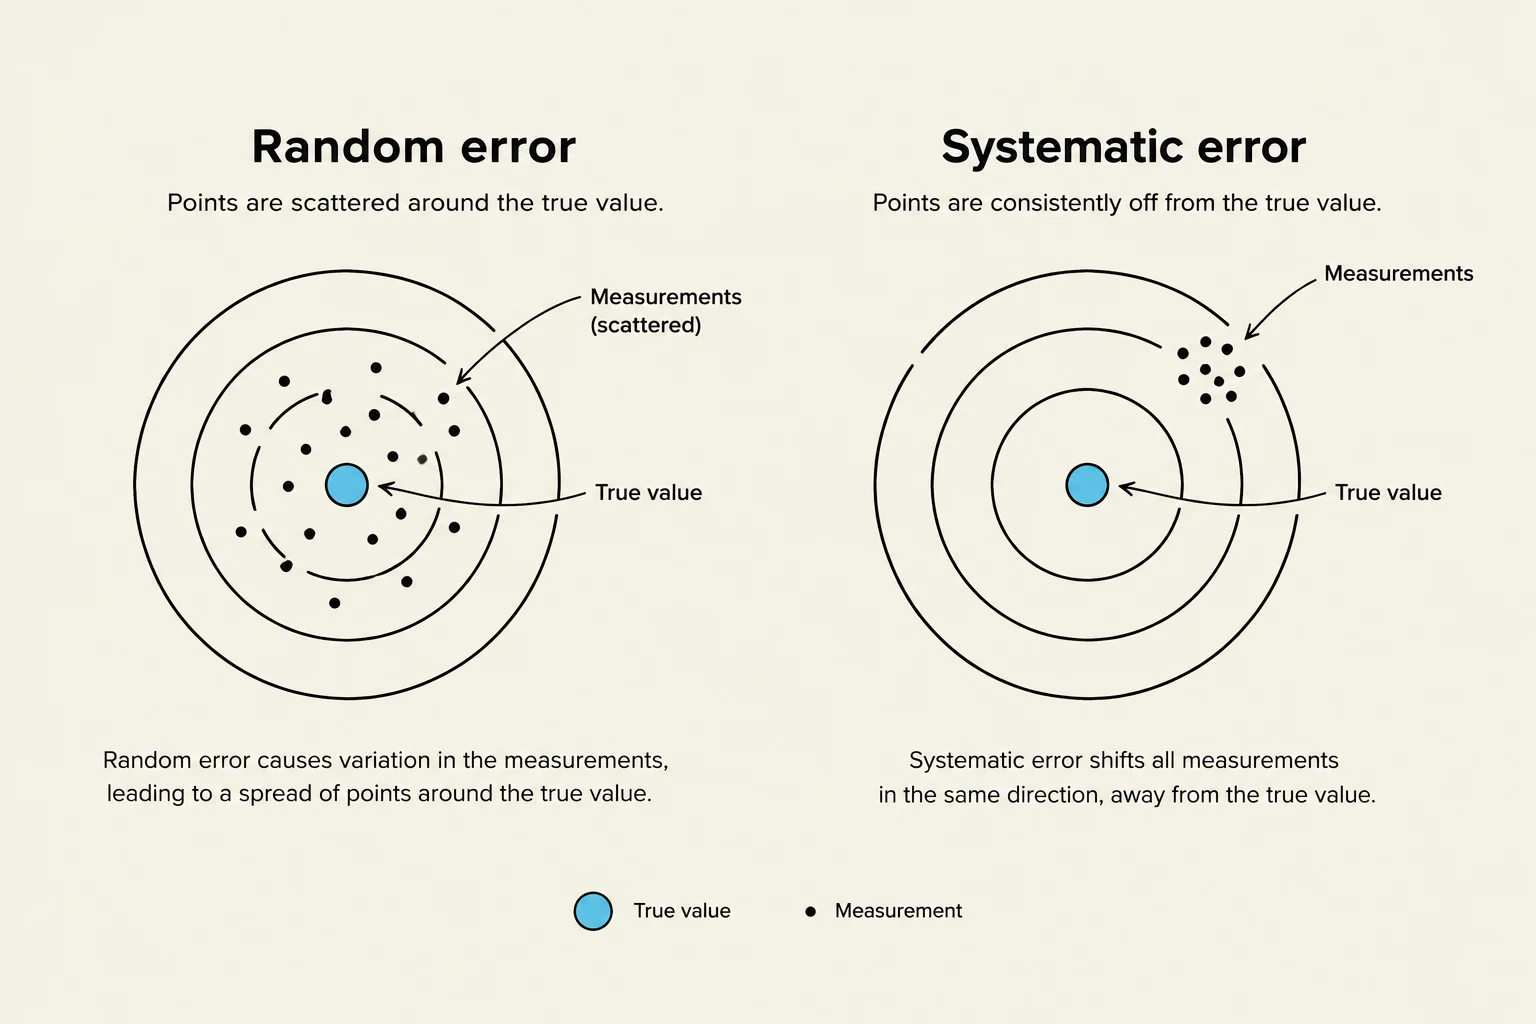
This illustration contrasts random error, where measurements are scattered around the true value, with systematic error, where measurements are consistently off from the true value.
Quantifying Reliability
Because reliability is a statistical concept, researchers use specific coefficients to determine how much of the variance in a set of scores is due to the "true score" versus "error."
A common way to think about this is through the ratio of variance. If we want to know how reliable a test is, we look at how much of the total variance in our scores is "true variance" compared to "error variance."
Reliability=Variance of Observed ScoresVariance of True Scores
Since the observed scores include both true scores and error, the denominator is always larger than (or equal to) the numerator. This means reliability is expressed as a number between 0 and 1. A reliability coefficient of 1.0 would mean there is zero measurement error, while a coefficient of 0 would mean the measurement is nothing but random noise.
Common Methods to Assess Reliability
In practice, researchers use several different approaches to check if their instruments are consistent:
Test-Retest Reliability: This involves administering the same test to the same group of people at two different points in time. If the scores are highly correlated, the measure is stable over time.
Inter-Rater Reliability: This is crucial when human observers are involved. It measures the degree of agreement between two or more different observers. If two researchers watch the same video and record the same behaviors, inter-rater reliability is high.
Internal Consistency: This checks whether different items on the same test that are intended to measure the same thing actually produce similar results. For example, if a survey asks three different questions about "happiness," a person's answers to all three should be highly correlated.
By understanding these mechanisms, researchers can better identify the limitations of their data and work to minimize error, ensuring that their findings are built on a stable foundation.
Keep reading for free.
Create an account to finish this reading and make it part of your study routine.