Explores the role of regulatory RNAs, including miRNAs, siRNAs, piRNAs, and lncRNAs, in controlling gene expression through mechanisms like RNA interference. Discusses their functions in cellular processes, defense, and research applications, as well as methods for transcriptome analysis like RNA-seq and scRNA-seq.
In the complex landscape of a eukaryotic cell, the presence of a gene does not guarantee its activity. While transcription factors and chromatin remodeling provide the primary "on/off" switches for DNA, a second, highly sophisticated layer of control exists at the RNA level. Regulatory RNAs function primarily through a mechanism known as RNA interference (RNAi). Rather than acting as templates for protein synthesis, these molecules serve as sequence-specific guides. By using base-pairing to recognize target mRNA sequences, they recruit effector protein complexes to reduce gene expression, providing a mechanism for rapid, fine-tuned, and reversible control of the proteome.
The Machinery of Interference: RISC and Argonaute
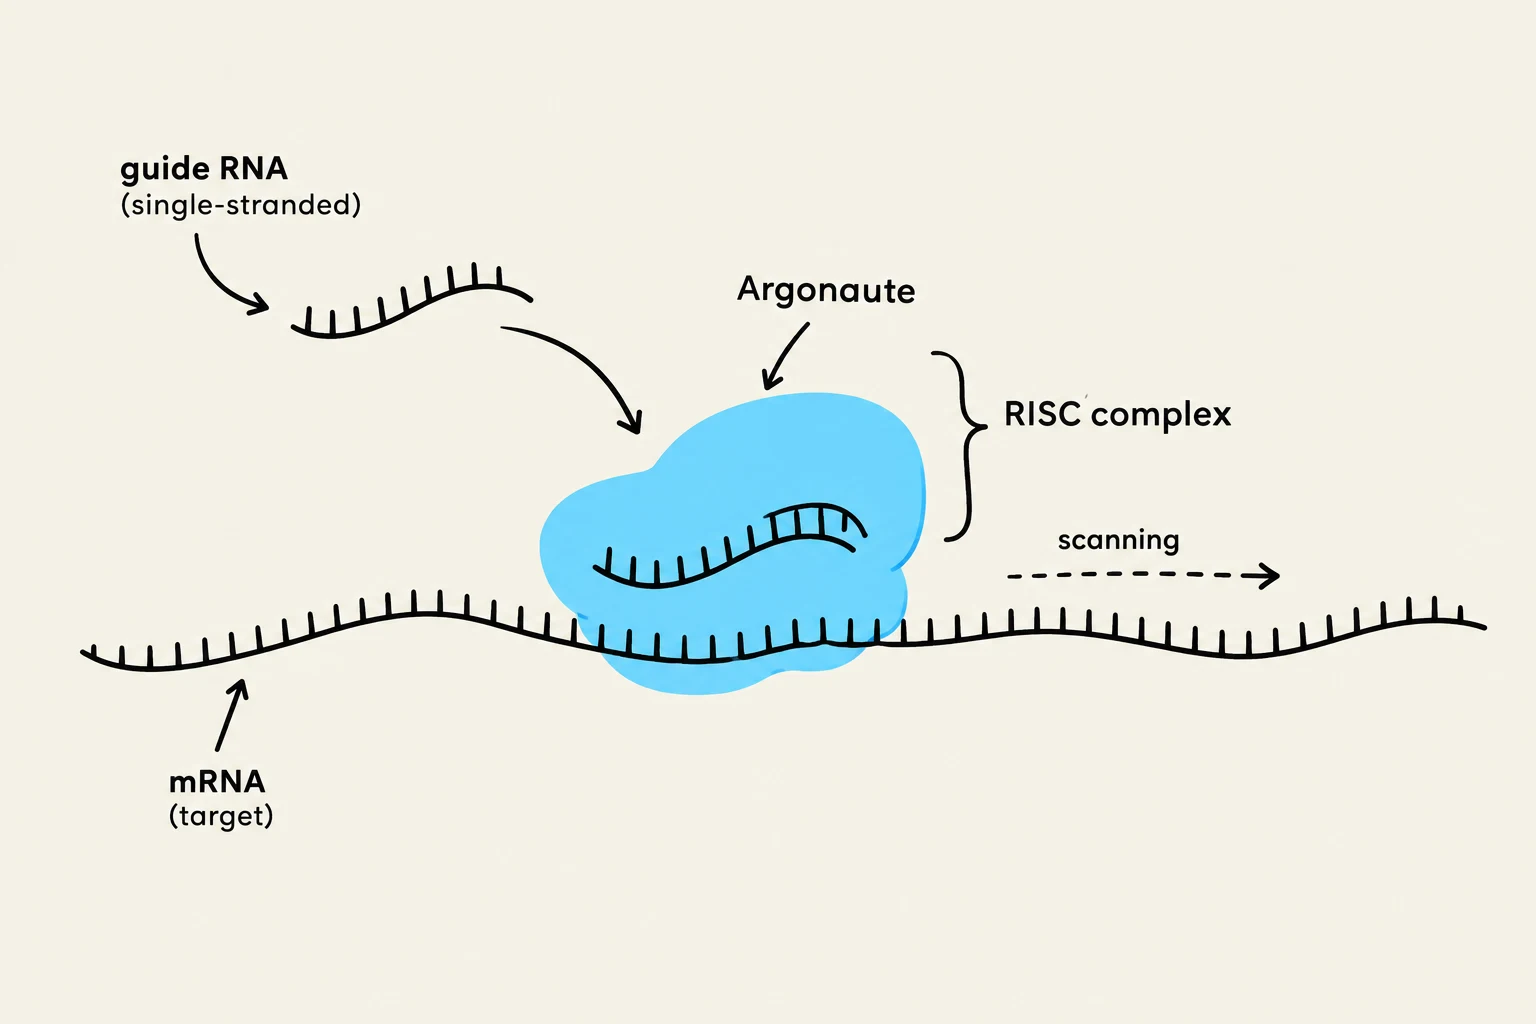
The core of RNA-mediated regulation is the formation of a ribonucleoprotein complex. When a short, single-stranded regulatory RNA finds its target, it does not act alone; it is loaded into an effector complex, most notably the RNA-induced silencing complex (RISC).
The central engine of RISC is a member of the Argonaute protein family. The regulatory RNA acts as a "guide strand," using its nucleotide sequence to search for complementary matches in the cell's pool of messenger RNAs (mRNAs). Once a match is found, the Argonaute protein facilitates the silencing of that specific target. This system is versatile, capable of inducing direct cleavage of the mRNA or simply blocking the machinery required for translation.
Diagram illustrating the RISC complex, composed of Argonaute, binding to a guide RNA and scanning an mRNA target.
MicroRNAs (miRNAs): The Master Regulators
MicroRNAs (miRNAs) are perhaps the most widespread regulators in animals, with approximately 1,000 different miRNAs identified in humans. It is estimated that they regulate over 50% of all protein-coding genes.
The lifecycle of a miRNA begins in the nucleus, where they are transcribed by RNA polymerase II. They undergo an initial "cropping" process in the nucleus before being exported to the cytosol, where they are "diced" by the enzyme Dicer into mature strands. Once loaded into RISC, the outcome of the interaction depends heavily on the species:
In Plants: miRNAs typically exhibit extensive complementarity to their targets. This leads to the Argonaute protein "slicing" the mRNA, resulting in rapid degradation.
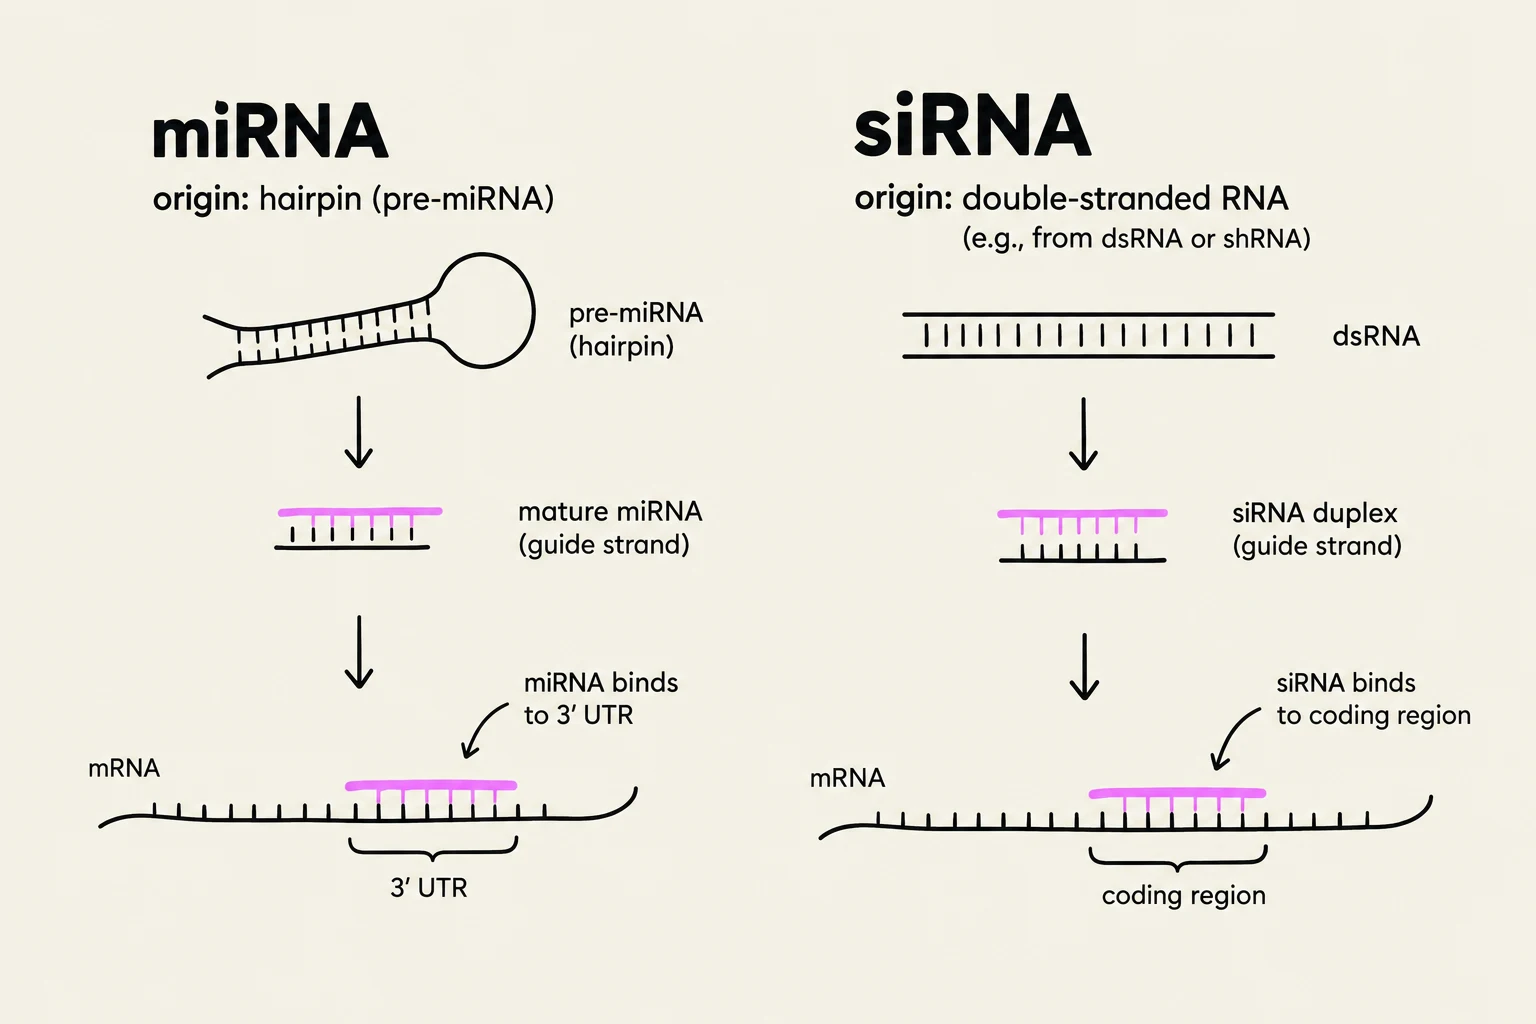
In Animals: miRNAs often exhibit only partial complementarity, typically targeting the 3′ Untranslated Region (3′ UTR) of the mRNA. Instead of immediate slicing, this usually results in translation repression, deadenylation (shortening of the poly-A tail), and sequestration of the mRNA into specialized cytoplasmic granules called P-bodies.
Exam Tip: Remember that one single miRNA can target hundreds of different mRNAs, and conversely, a single mRNA 3' UTR can be targeted by multiple miRNAs acting combinatorially to ensure tight regulation.
siRNAs and the Defense Against Invaders
While miRNAs are endogenous regulators of development and homeostasis, Small interfering RNAs (siRNAs) often function as a defense mechanism. siRNAs derive from long, double-stranded RNA (dsRNA) molecules that are cleaved by Dicer into ~23-nucleotide duplexes.
Unlike miRNAs, siRNAs typically require perfect complementarity to their targets. When loaded into RISC, they direct the precise cleavage of the target RNA. This pathway is a critical component of antiviral defense, protecting the cell from viral genomes and mobile genetic elements (transposons) that produce dsRNA.
In the laboratory, scientists hijack this natural process for RNA interference (RNAi) experiments. By introducing synthetic siRNAs into a cell, researchers can "knock down" the expression of almost any specific gene to study its function.
Specialized Silencing: piRNAs and CRISPR
Beyond the standard miRNA and siRNA pathways, evolution has produced specialized systems for extreme genomic threats.
piRNAs and Transposon Silencing
In the animal germline (cells that produce eggs and sperm), the genome faces a constant threat from transposons—"jumping genes" that can move and cause mutations. Piwi-interacting RNAs (piRNAs) associate with Piwi proteins to combat this. Unlike miRNAs, piRNAs are generated from single-stranded precursors found in specific genomic regions called piRNA clusters. They work through a "ping-pong" amplification cycle that both cleaves transposon RNA and generates new piRNAs, ensuring a robust and heritable defense that can even modify chromatin to silence transposons at the DNA level.
CRISPR: The Bacterial Immune System
In bacteria, a similar logic is applied through CRISPR RNAs (crRNAs). CRISPR arrays act as a molecular "record" of past viral infections. When a virus attacks again, the cell transcribes these arrays into crRNAs, which guide CRISPR-associated proteins to recognize and cleave the matching viral DNA or RNA, providing sequence-specific immunity.
This diagram illustrates the mechanisms of microRNA (miRNA) and small interfering RNA (siRNA) in gene regulation. miRNA originates from a hairpin structure and guides the mature miRNA to bind to the 3' UTR of mRNA. siRNA originates from double-stranded RNA and guides the siRNA duplex to bind to the coding region of mRNA.
Long Noncoding RNAs (lncRNAs): The Genomic Scaffolds
Not all regulatory RNAs are small. Long noncoding RNAs (lncRNAs) are transcripts longer than 200 nucleotides that do not code for proteins. Because of their length and ability to fold into complex shapes, they function as molecular scaffolds.
lncRNAs can bring together multiple transcription regulators or coactivators into a single complex at a specific genomic locus. They also act as guides, recruiting chromatin-modifying enzymes to specific regions of the genome to either open or close the chromatin structure. A famous example of lncRNA-mediated regulation is Xist, which facilitates X-chromosome inactivation in female mammals by recruiting repressive complexes to silence an entire chromosome.
Measuring the Transcriptome: RNA-seq and scRNA-seq
To understand how these regulatory RNAs influence a cell, scientists use high-throughput sequencing technologies.
Bulk RNA Sequencing (RNA-seq)
RNA-seq converts the total RNA of a sample into DNA, which is then sequenced to reveal expression patterns.
Data Interpretation: The number of reads (sequenced fragments) for a specific gene correlates with its expression level; more reads indicate higher abundance.
Gene Classification: Analysis can distinguish between housekeeping genes (required for basic survival, like ribosomal proteins) and tissue-specific genes (like insulin in the pancreas).
Visualization:Heatmaps are used to visualize expression across many genes and conditions. In a heatmap, rows represent genes and columns represent cell types. Colors (e.g., red for high, blue for low) allow researchers to identify clusters of co-regulated genes.
Cautionary Note: While RNA-seq is a powerful tool, mRNA abundance does not always perfectly predict protein expression. Post-transcriptional controls—such as the very miRNAs and siRNAs discussed here—can prevent an mRNA from being translated into a protein.
Single-cell RNA Sequencing (scRNA-seq)
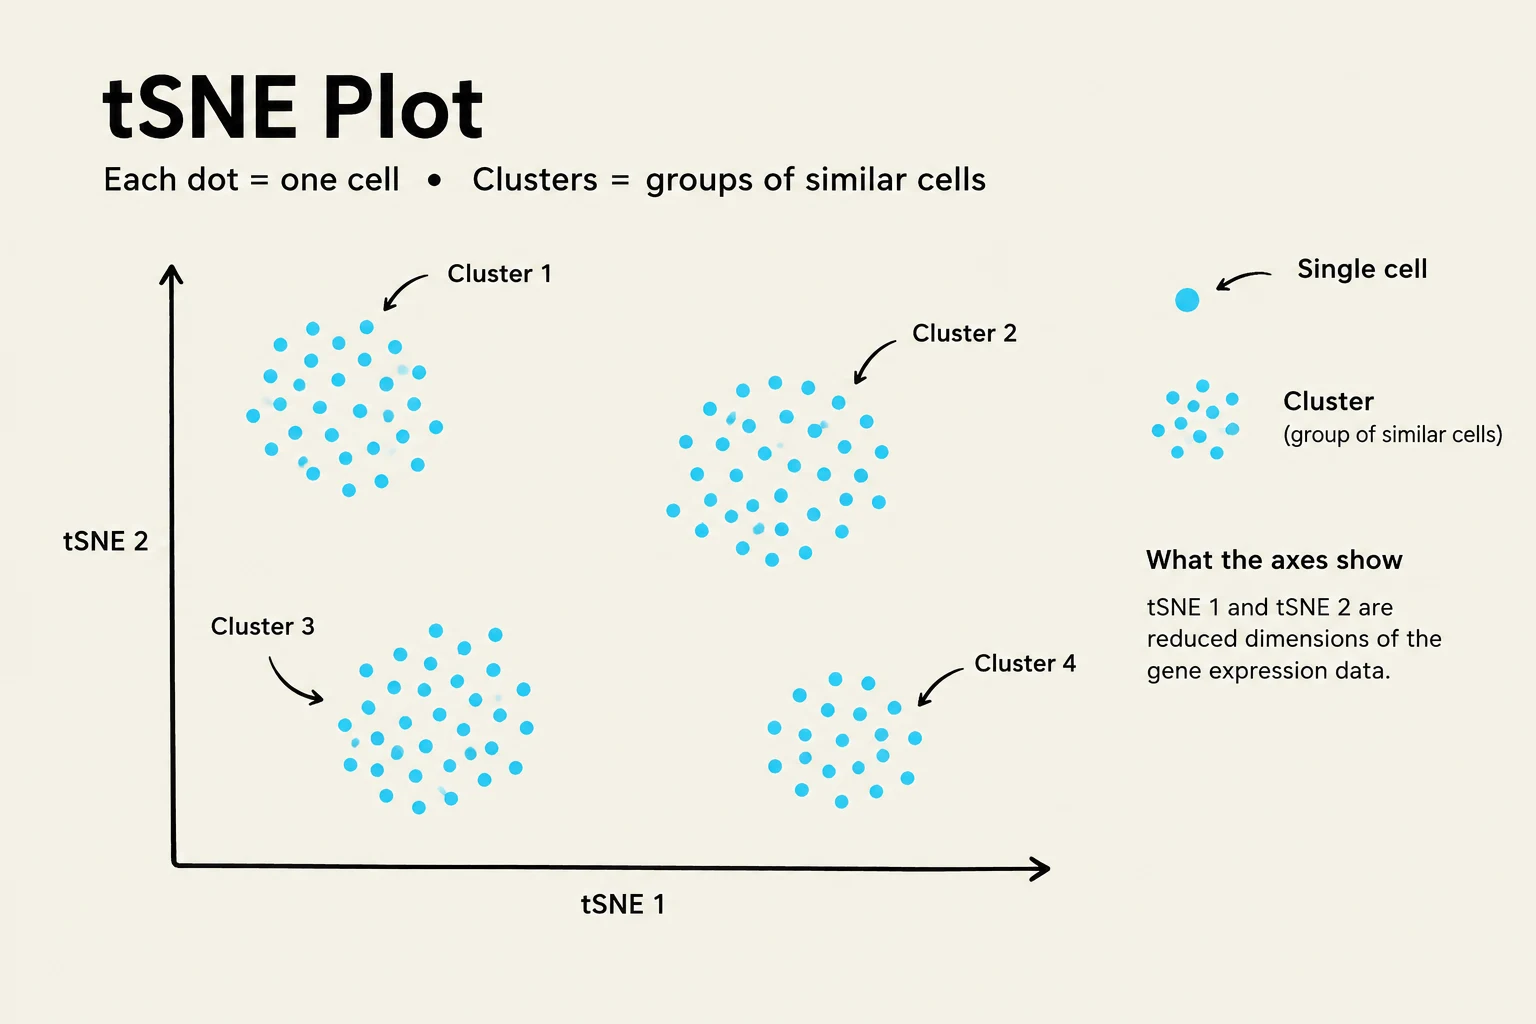
While bulk RNA-seq provides an "average" view of a tissue, single-cell RNA sequencing (scRNA-seq) reveals cell heterogeneity by analyzing the transcriptome of individual cells. This allows researchers to see how different cells within the same tissue might be in different functional states. A common way to visualize this data is through tSNE (t-distributed Stochastic Neighbor Embedding), a dimensionality reduction technique where each dot represents a single cell. Cells with similar transcriptomes will cluster together in 2D space, revealing distinct cell populations.
A t-SNE plot illustrating the clustering of cells based on gene expression data. Each dot represents a single cell, and clusters represent groups of similar cells. The axes tSNE 1 and tSNE 2 show reduced dimensions of the gene expression data.
Keep reading for free.
Create an account to finish this reading and make it part of your study routine.