Explains the fundamental economic principles of supply and demand in the real estate market, detailing the drivers of demand (demographics, income, financing) and the constraints on supply (zoning, costs, time lags), leading to market equilibrium.
In the world of economics, few markets are as complex or as impactful as real estate. Unlike a stock market where a digital transaction can occur in milliseconds, the real estate market is characterized by high transaction costs, significant time lags, and physical constraints. To understand why home prices fluctuate, we must look beyond simple headlines and examine the fundamental interplay between supply and demand.
The Drivers of Demand
Demand in the real estate market represents the desire and ability of consumers to purchase property at various price points. It is not merely a "want" for a home, but a functional capacity to acquire it. Several key drivers influence how much demand exists in a given period.
Demographics and Life Cycles
Demographics are perhaps the most predictable driver of long-term demand. Population growth, age distribution, and household formation patterns dictate who needs housing. For example, a "baby boom" generation entering their prime home-buying years creates a massive surge in demand for single-family homes, while an aging population might shift demand toward smaller, accessible condos or assisted living facilities.
Income and Wealth
Real estate is a significant portion of most household balance sheets. As disposable income rises, the pool of qualified buyers expands. Furthermore, general wealth—often tied to the performance of other assets like the stock market—can create a "wealth effect," where consumers feel more confident taking on large mortgage debts because their overall net worth has increased.
Mortgage Rates and Financing
Because most real estate is purchased using leverage (borrowed money), the cost of debt is a critical lever for demand. The relationship between mortgage rates and demand is generally inverse:
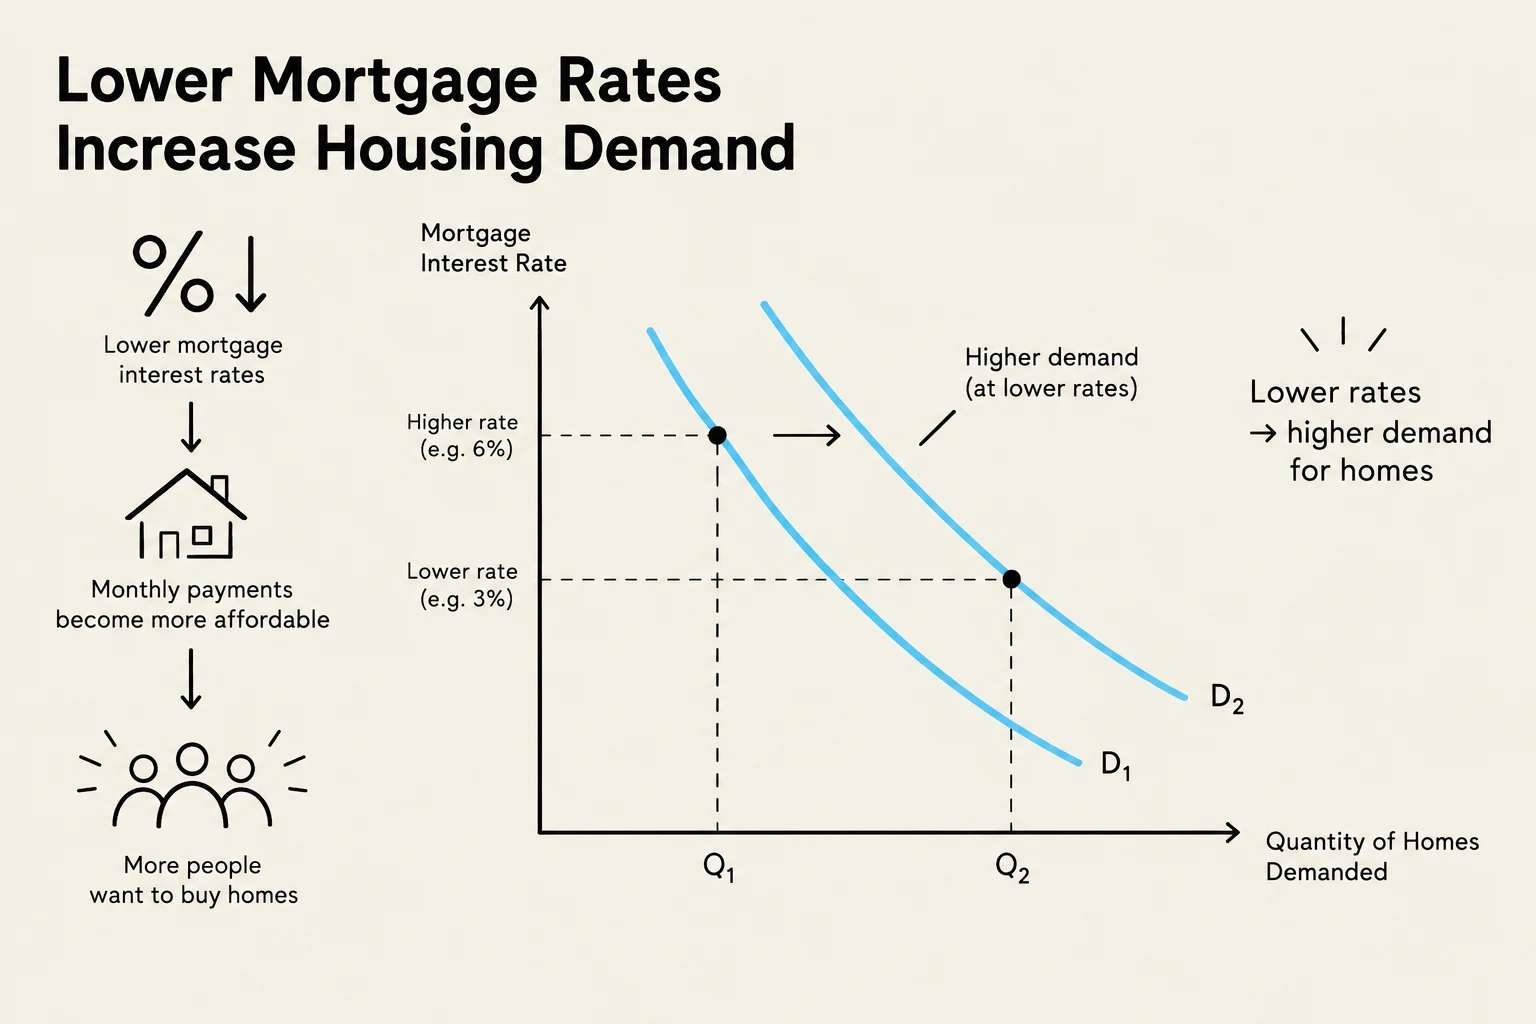
Low Interest Rates: Decrease the monthly cost of a mortgage, increasing the purchasing power of buyers and shifting the demand curve outward.
High Interest Rates: Increase the cost of borrowing, reducing the number of people who can afford a monthly payment, thereby shifting the demand curve inward.
This graph illustrates how lower mortgage interest rates lead to increased housing demand. As rates decrease, monthly payments become more affordable, encouraging more people to buy homes. The graph shows two demand curves, D1 and D2, with D2 representing higher demand at lower interest rates.
Exam Tip: When analyzing demand, always distinguish between a change in demand (a shift of the entire curve due to factors like demographics) and a change in quantity demanded (a movement along the curve due to a change in the price of the property itself).
The Constraints on Supply
While demand can shift relatively quickly due to economic or social changes, supply in real estate is "inelastic" in the short term. This means that even if prices skyrocket, builders cannot instantly conjure new houses to meet that demand.
Zoning and Regulatory Barriers
One of the most significant constraints on supply is land-use regulation. Local governments use zoning laws to dictate what can be built and where. If a city is zoned exclusively for single-family homes, a sudden surge in demand for apartments cannot be met because the legal framework prevents higher-density construction. This creates a "supply ceiling" that keeps prices artificially high.
Construction Costs and Inputs
The supply of new housing is heavily dependent on the cost of production. This includes:
Raw Materials: Lumber, steel, concrete, and copper.
Labor: The availability of skilled tradespeople (electricians, plumbers, carpenters).
Land Acquisition: The cost of purchasing the underlying plot.
If the cost of these inputs rises, the profit margin for developers shrinks, leading them to delay or cancel new projects, which further constricts supply.
Time Lags in Development
The "pipeline" of real estate is long. From the moment a developer identifies a site to the moment a resident moves in, several years may pass. This process involves land acquisition, securing financing, obtaining permits, site preparation, and actual construction. Because of this lag, supply often reacts to market signals that are already outdated.
This diagram illustrates the five key stages of real estate development: planning and entitlements, land preparation, construction, completion, and occupancy, along with their estimated timelines.
Reaching Market Equilibrium
Market equilibrium occurs at the price point where the quantity of housing demanded by buyers exactly equals the quantity of housing supplied by sellers.
In a theoretical model, we can express the relationship between price (P), supply (S), and demand (D) through the equilibrium condition:
Qs(P)=Qd(P)
Where Qs is the quantity supplied and Qd is the quantity demanded.
Imbalances: Shortages and Surpluses
When the market is not in equilibrium, we see two distinct phenomena:
Shortage (Excess Demand): This occurs when the current market price is below the equilibrium price. Demand exceeds supply, leading to bidding wars and rapid price appreciation. This is common in "hot" markets with high migration and restrictive zoning.
Surplus (Excess Supply): This occurs when the price is above equilibrium. There are more homes on the market than there are buyers willing to pay those prices. This often leads to price corrections or "market crashes" as sellers are forced to lower prices to attract buyers.
This graph illustrates the economic principles of supply and demand, showing how the price and quantity of a good or service reach equilibrium where the supply and demand curves intersect.
Summary Note: Real estate cycles are essentially the story of the "lag" between these two forces. Demand shifts often happen rapidly (due to interest rate changes or demographic shifts), while supply responds slowly (due to construction and zoning), creating the boom-and-bust cycles characteristic of the industry.
Keep reading for free.
Create an account to finish this reading and make it part of your study routine.