


When starting any quantitative research project, your first task is to understand what your data actually looks like. This is achieved through descriptive statistics, which summarize the main characteristics of your dataset. Before you can jump into complex modeling, you must ensure your variables are measured correctly and that the items you intend to combine into a scale actually measure the same underlying construct through reliability analysis.
Understanding Measurement Levels
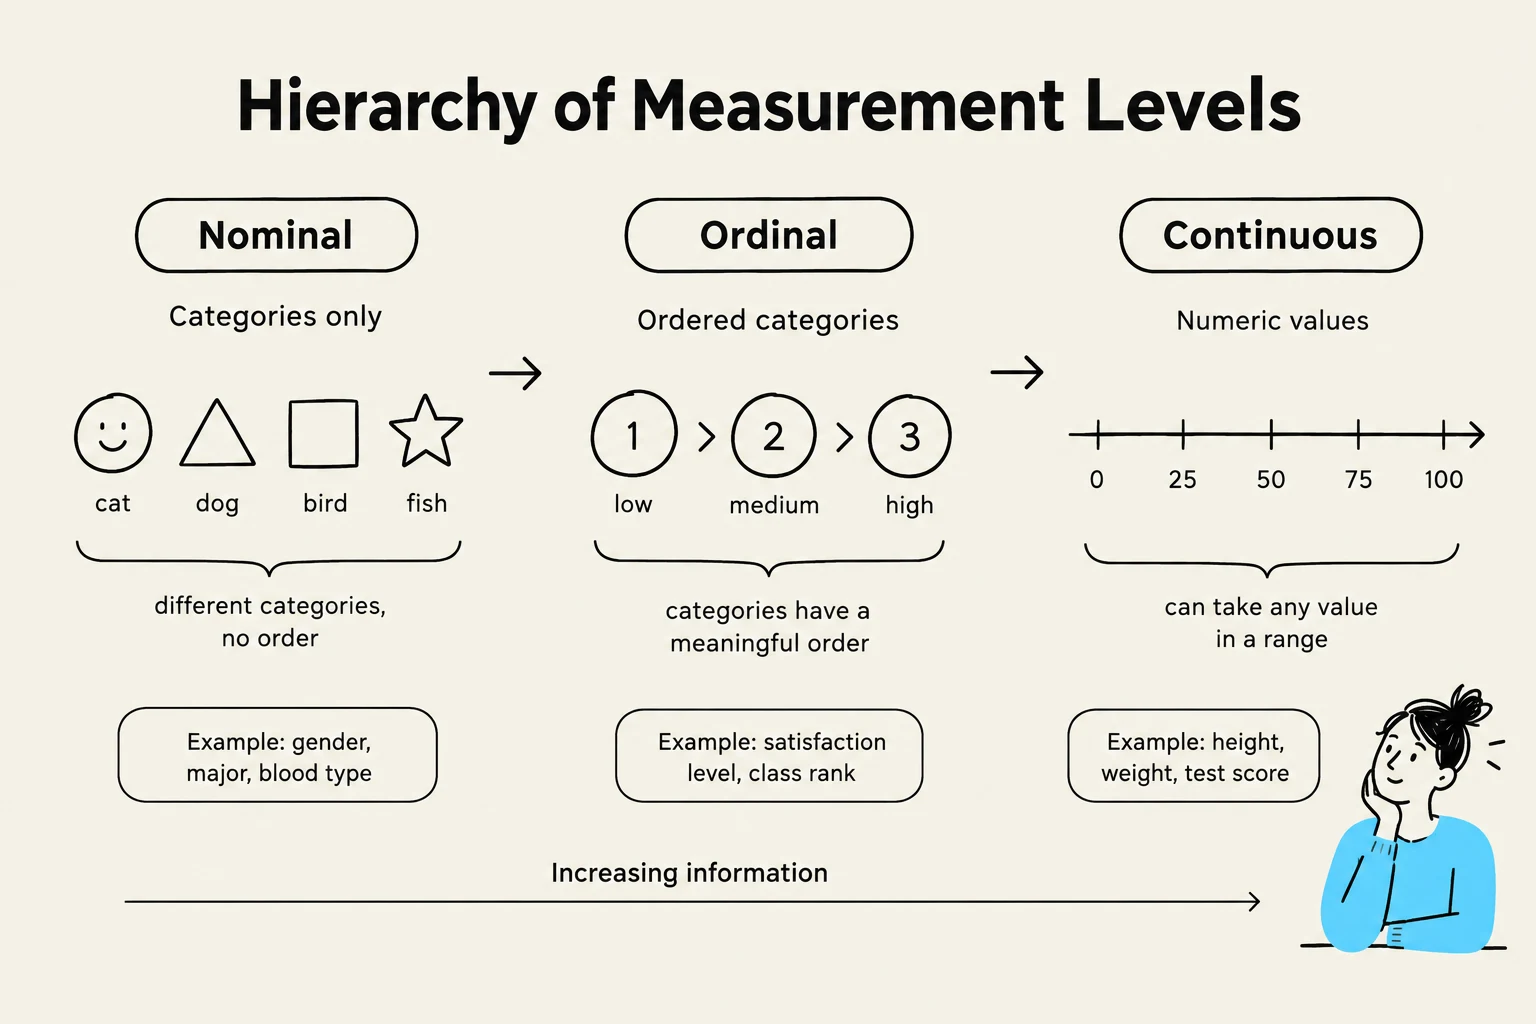
Before writing a single line of R code, you must identify the measurement level of every variable in your dataset. The type of statistical test you can run depends entirely on this classification.
There are three primary levels of measurement to consider:
- Nominal variables: These are categorical variables consisting of groups without any meaningful order, such as gender or experimental condition. In R, these are typically stored as
factortypes. - Ordinal variables: These are categorical variables where the categories have a meaningful order, such as Likert scales or education levels. While they represent order, the "distance" between categories may not be equal. In R, these are often stored as
numeric. - Continuous variables: These are numerical values (interval or ratio levels) where the differences between values are meaningful and equal, such as age, height, or weight. These are stored as
numericin R.
Inspecting Your Data in R
To begin your analysis, you need to load your data and inspect its structure. Using the tidyverse suite, specifically the dplyr package, allows for efficient data manipulation.
Keep reading for free.
Create an account to finish this reading and make it part of your study routine.
Continue reading freeAlready have an account? Log in
Updated