Quantitative, Qualitative, and Mixed Methods Research Approaches
An overview of the three primary research approaches: quantitative, qualitative, and mixed methods. This guide explains their underlying assumptions, methods, data types, and philosophical foundations, including ontology and epistemology.
Research is the primary method by which a profession advances its knowledge base. While the terms "science" and "research" are often used interchangeably, science is the discovery of knowledge, whereas research is the specific, logical method used to achieve that discovery. To conduct effective research, one must follow a systematic process to find solutions to problems or discover new information.
Understanding how to conduct research requires more than just picking a topic; it requires an understanding of research designs, the data being collected, and the philosophical foundations that guide every decision a researcher makes.
The Three Primary Research Approaches
Creswell (2014) identified three main approaches to research: quantitative, qualitative, and mixed methods. Each approach differs in its underlying assumptions, the types of questions asked, the specific methods used, and the type of data produced.
Quantitative Research
Quantitative research focuses on the generation of numerical data to answer research questions. This approach is best suited for testing theories, determining the status of variables, identifying differences between groups, or exploring relationships among variables.
Key characteristics of quantitative research include:
Objectivity: Researchers attempt to remain as unbiased as possible.
Large Samples: They typically use large sample sizes to ensure results can be applied to broader populations.
Measurement and Statistics: There is a heavy focus on measuring variables and using statistical analysis to interpret the data.
An example of quantitative research can be seen in historical studies of the cholera epidemics in London. By looking at death rates (e.g., 4.2 deaths per 1,000 people vs. 0.5 deaths per 1,000 people) based on water sources, researchers could use numerical data to identify patterns and causes.
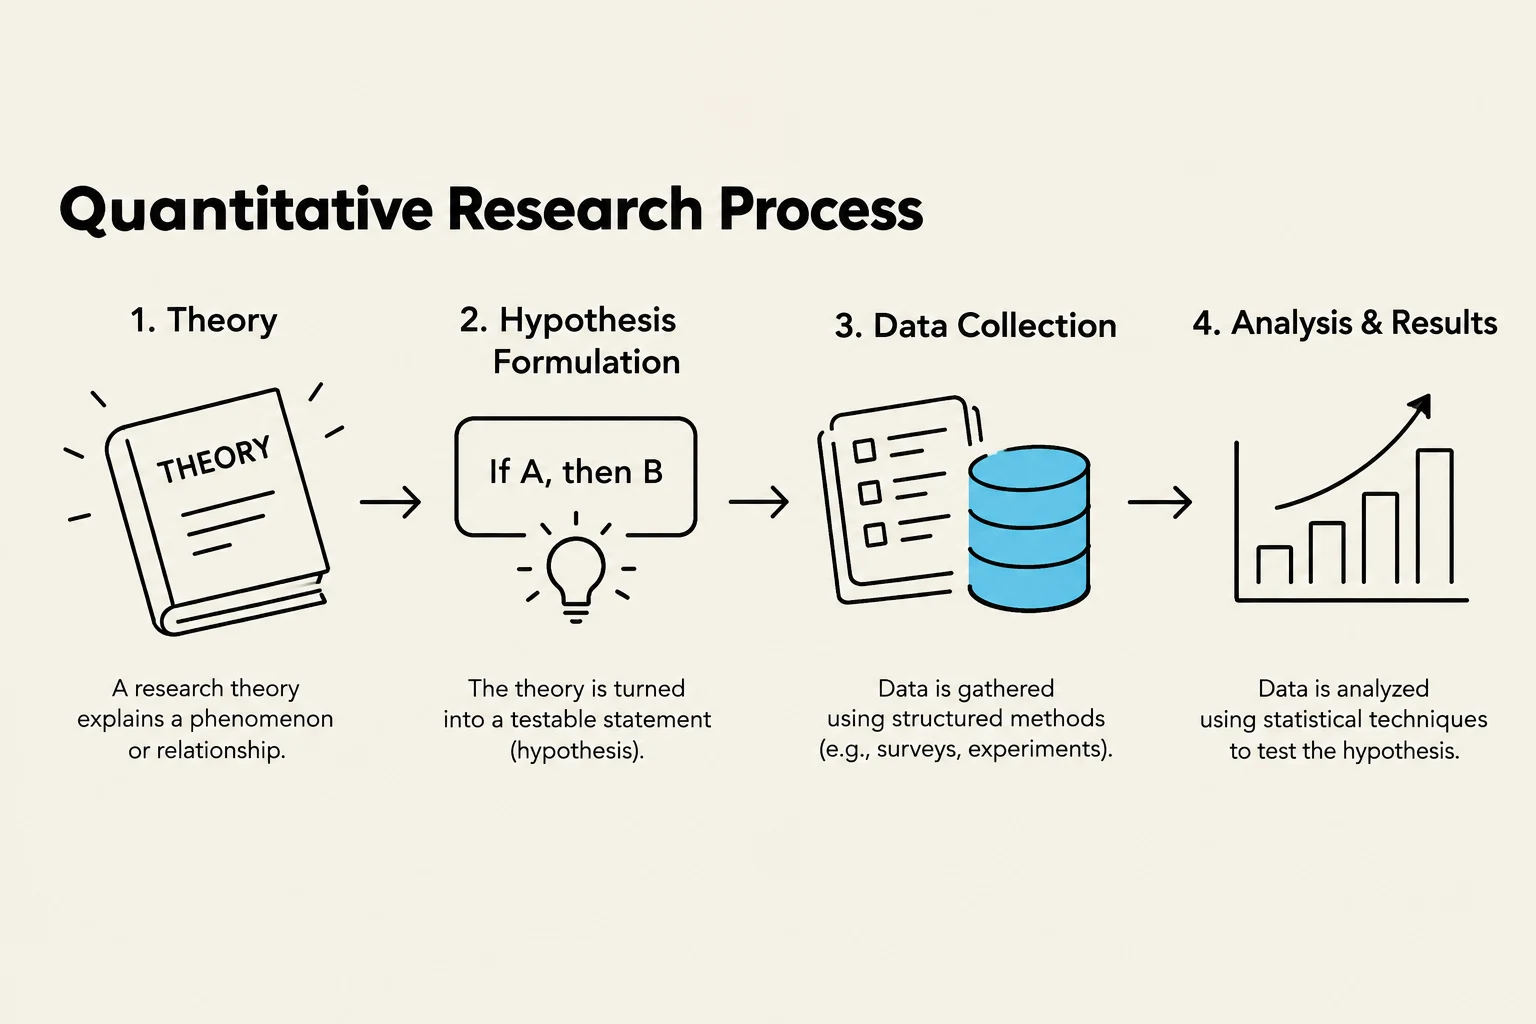
The quantitative research process involves theory, hypothesis formulation, data collection, and analysis of results.
Qualitative Research
Qualitative research involves the generation and interpretation of non-numerical data. Instead of numbers, researchers look for meanings, experiences, and descriptions.
Key characteristics of qualitative research include:
Natural Settings: Data is often collected where participants live or work.
Emergent Design: The research plan is flexible and can change as the researcher learns more.
Small Samples: Because the focus is on depth rather than breadth, sample sizes are typically much smaller than in quantitative studies.
Subjectivity: The researcher is an integral part of the process, and the study often seeks to understand the complex, subjective meanings people assign to their experiences.
Common sources for qualitative data include open-ended interviews, direct observations, written documents, and art-based methods.
Mixed Methods Research
Mixed methods research combines both quantitative and qualitative approaches. This allows researchers to use the strengths of both numerical precision and descriptive depth. These designs can prioritize one method over the other, or conduct them simultaneously or sequentially.
Worked Example: Medical Education
In a study regarding medical students' competence in treating patients with obesity, researchers used a mixed-methods approach.
Quantitative component: A questionnaire showed that only 14% of students felt competent in physical exams.
Qualitative component: Semi-structured focus groups revealed why they felt this way (e.g., lack of early exposure and minimal instruction).
By combining these, the researchers provided a complete picture of the problem and the necessary solutions.
This diagram illustrates the integration of quantitative and qualitative research paths to achieve a richer understanding.
Philosophical Foundations: Ontology and Epistemology
Before choosing a method, a researcher must understand their philosophical worldview. This is built upon two fundamental concepts: Ontology and Epistemology.
Ontology is the study of what exists—the nature of reality.
Epistemology is the study of how we come to know and understand that reality.
These concepts dictate what a researcher considers to be "valid" knowledge.
Philosophical Worldviews
Different research approaches align with specific philosophical worldviews.
Postpositivism
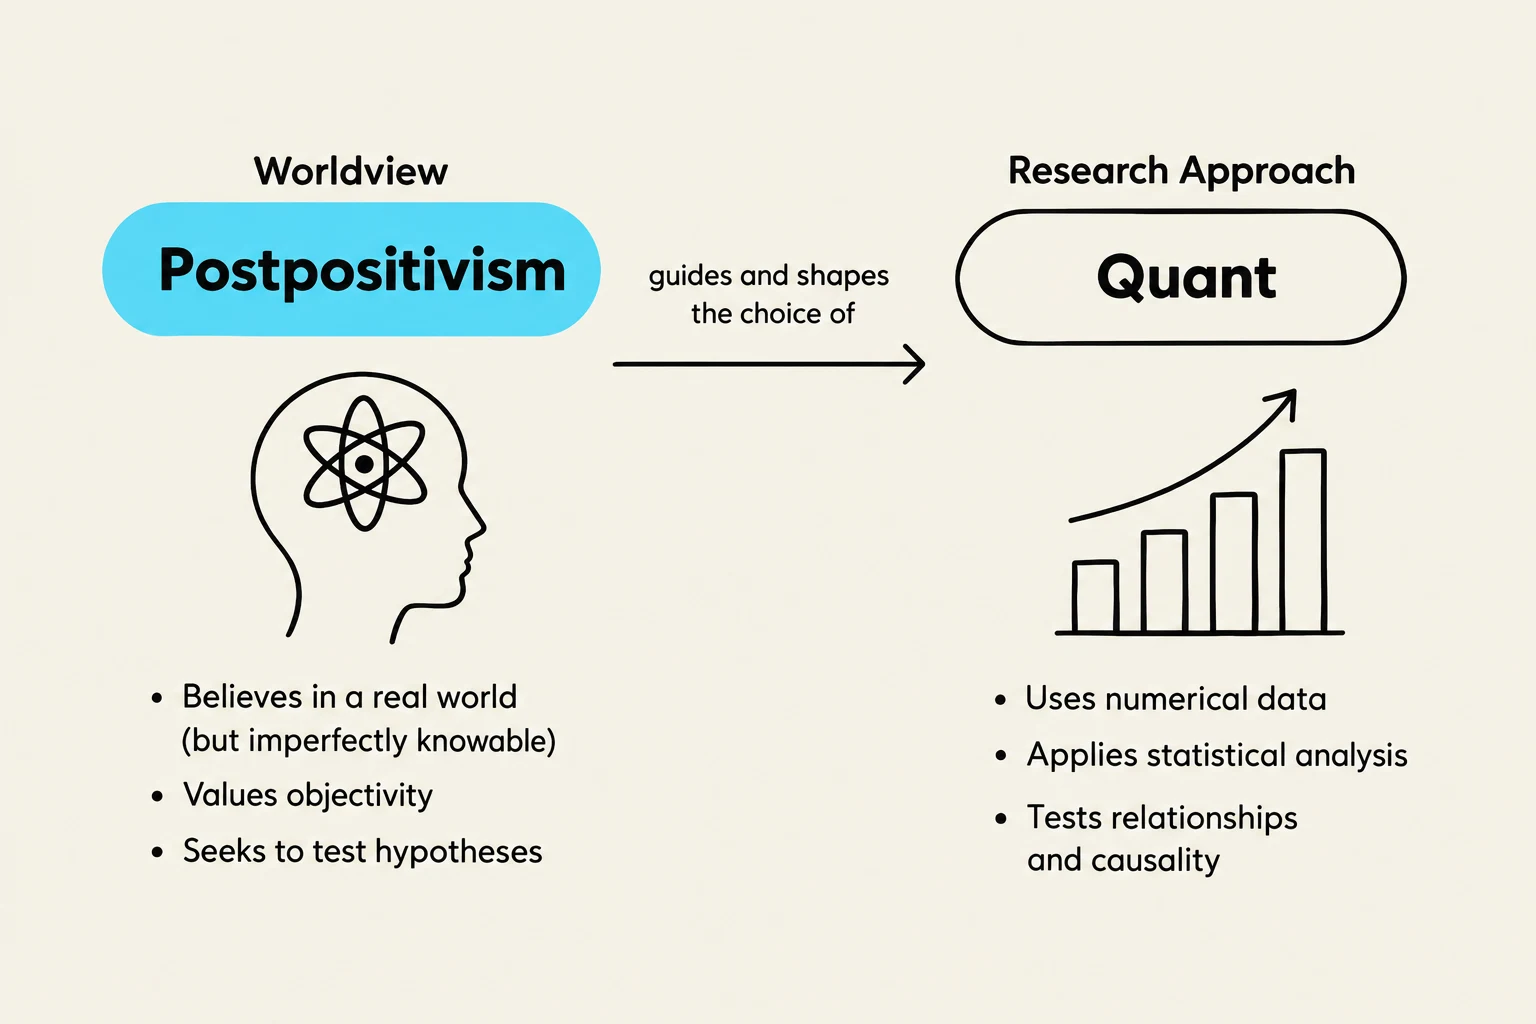
Postpositivism is rooted in the idea that there is a single, objective reality or truth. It relies on the scientific method, determinism (the idea that causes determine effects), and reductionism (the ability to reduce complex ideas into testable questions). This worldview aligns most closely with quantitative research.
Constructivism
Constructivism holds that multiple realities exist and that meaning is subjective and socially constructed. Researchers using this worldview seek to understand the complexity of various views and recognize that their own perspectives shape the research process. This aligns closely with qualitative research.
Pragmatism
Pragmatism is less concerned with the nature of reality and more concerned with "what works" to solve a problem. Pragmatists do not commit to a single notion of reality; instead, they use all research approaches—both quantitative and qualitative—that are necessary to understand the problem at hand. This is the philosophical foundation for mixed methods research.
Transformative Worldview
The transformative worldview is driven by an agenda of social reform and political change. Research is seen as inherently collaborative and is often guided by theoretical frameworks like feminist theory. While it aligns heavily with qualitative research, quantitative elements can also be used to support the goal of improving the lives of participants.
Two-Eyed Seeing
"Two-eyed seeing" is an increasingly important worldview, particularly in Indigenous health research. It involves bringing together the strengths of two different knowledge systems: Indigenous ways of knowing and European-derived (Western) sciences. In this worldview, all knowledge systems are considered equitable, allowing for a rich diversity of perspectives.
This diagram illustrates the relationship between the Postpositivism worldview and the Quantitative research approach, highlighting key characteristics of each.
Exam Tip: If a question asks about the "nature of reality," it is referring to Ontology. If it asks about "how we acquire knowledge," it is referring to Epistemology.
Summary of Research Design Components
A complete research design is not a random collection of steps; it is a linked system where the approach and the methods must match. The process generally follows these stages:
Conceptualizing the Study: Defining the problem and questions.
Designing the Study: Choosing the worldview, approach, and methods.
Conducting the Study: The actual data collection and analysis.
Knowledge Mobilization: Sharing the findings to impact practice or policy.
By aligning their philosophical worldview with the appropriate research approach, researchers ensure that their findings are robust, verifiable, and capable of advancing their professional field.
Keep reading for free.
Create an account to finish this reading and make it part of your study routine.