This content explains how to quantify the genome by measuring N (ploidy) and C (genome size) values, and discusses evolutionary mechanisms like whole genome duplication, chromosome fusion/fission, and the C-value paradox.
To understand an organism, one must first understand its genetic blueprint. Just as a mayor needs to know the population and size of a city to govern effectively, a biologist must quantify the genome to understand how a species functions, evolves, and responds to disease. Quantification allows us to move beyond qualitative descriptions and into measurable data, enabling meaningful comparisons between species and providing a foundation for studying evolutionary history.
Measuring the Genome: N and C Values
When we talk about "measuring" a genome, we are looking at two distinct but related properties: the number of unique chromosomes and the actual amount of DNA present.
The N Value (Ploidy)
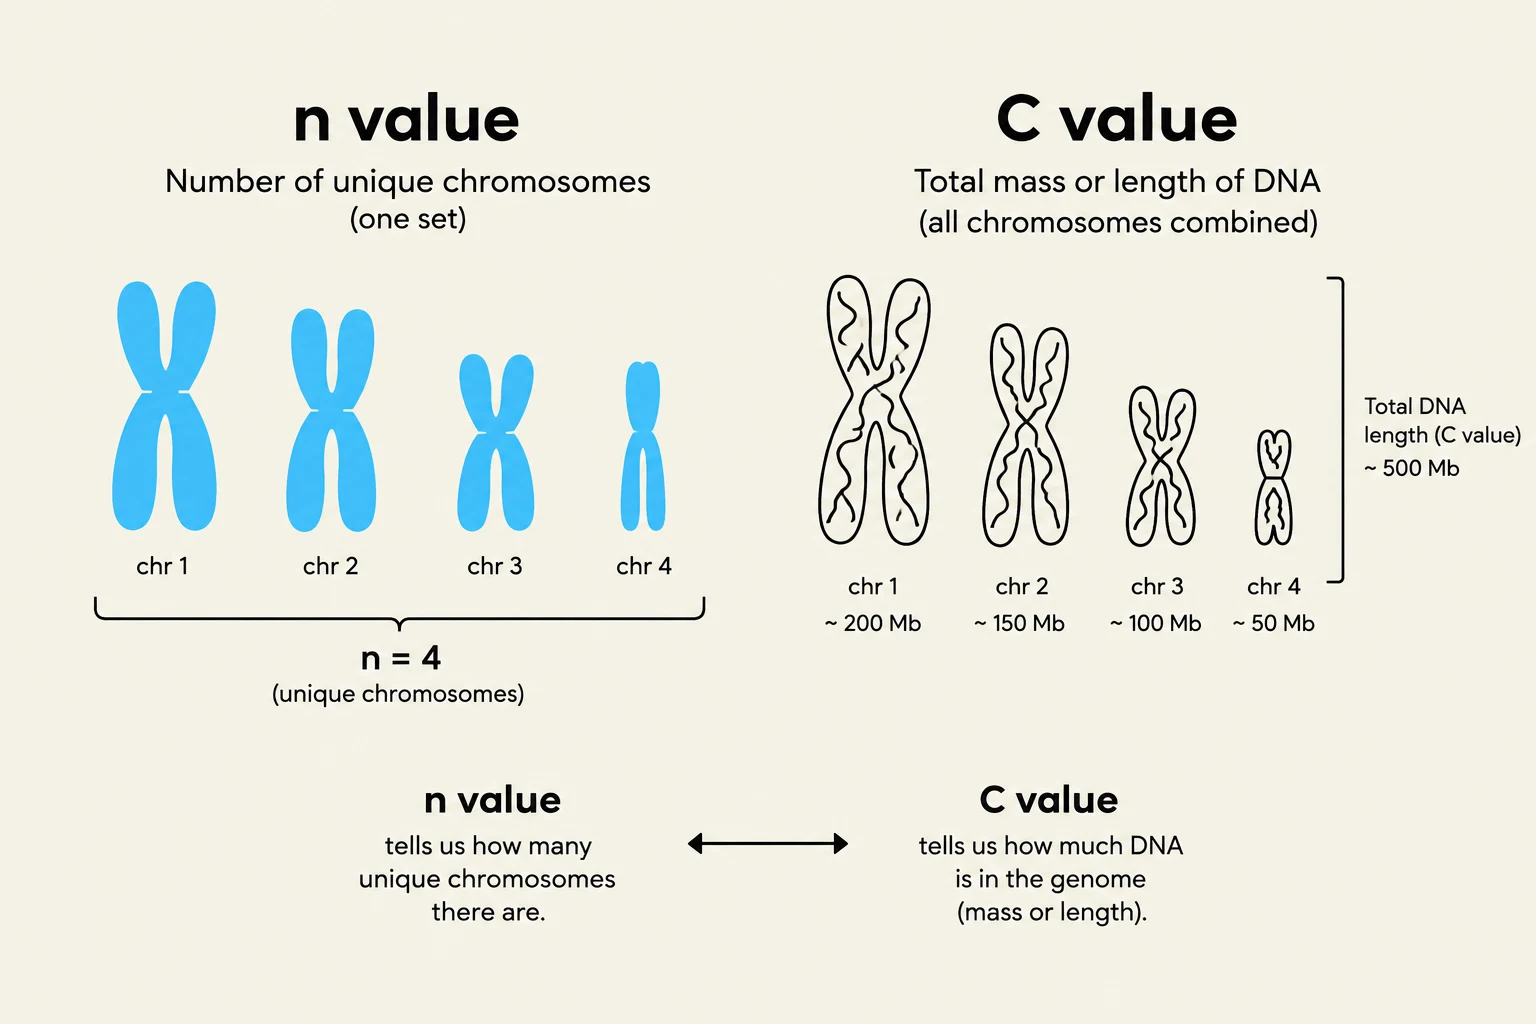
The n value refers to the number of unique nuclear chromosomes in an organism. This is often referred to as the ploidy or the coefficient of n. For example, humans have 23 unique chromosomes. If an organism is diploid ($2n$), it has two sets of these unique chromosomes (one from each parent).
The C Value (Genome Size)
The C value, or genome size, represents the total amount of DNA found in a single set of unique chromosomes. It is typically measured in base pairs (bp) or picograms (pg).
Crucial Distinction: The C value is the amount of DNA in a haploid cell (like a sperm or egg). It is not the total amount of DNA in a diploid nucleus. For a human ($2n$), the genome size is approximately 3.2 billion base pairs, but a diploid cell contains $2C$, or 6.4 billion base pairs.
This illustration explains the concepts of n value and C value in genetics. The n value represents the number of unique chromosomes in a set, while the C value represents the total mass or length of DNA in a genome.
The Coefficient of C
While the C value is a constant for a species, the coefficient of C describes how many copies of that genome are currently present in a specific cell.
In a haploid cell: $1C$
In a diploid cell (G1 phase): $2C$
After DNA replication (S phase/G2 phase): $4C$
Exam Tip: The C value (the amount of DNA in one set) is constant for a species and does not change during the cell cycle. However, the coefficient of C (the number of copies) changes as the cell replicates its DNA during the S phase.
Evolutionary Drivers of Genome Change
Genomes are not static; they change over evolutionary time through various mechanisms that alter their size and chromosomal makeup.
Whole Genome Duplication
One of the most dramatic changes is whole genome duplication, where an entire set of chromosomes is copied. This results in polyploidy (e.g., triploid, tetraploid, hexaploid). While often lethal in humans, polyploidy is common and beneficial in plants, providing "backups" for genes in harsh environments.
Chromosome Fusion and Fission
The number of chromosomes can change without changing the total amount of DNA through:
Fusion: Two chromosomes join to become one, decreasing the total chromosome count.
Fission: A large chromosome splits into smaller pieces, increasing the total chromosome count.
This illustration depicts chromosome fusion, where two chromosomes combine to form one, and chromosome fission, where one chromosome splits into two.
Repetitive DNA and Transposable Elements
A significant portion of many genomes consists of repetitive DNA rather than functional genes. The most common type is transposable elements, often called "jumping genes" because they can copy and paste themselves to different locations within the genome. In humans, for instance, only about 1.2% of the genome consists of protein-coding genes; the rest is largely composed of these elements, introns, and other non-coding sequences.
The C-Value Paradox and Biological Complexity
A common misconception is that a larger genome equates to a more complex organism. This is known as the C-value paradox: there is no direct correlation between genome size and biological complexity.
Consider these examples:
The Axolotl: Has a massive genome (roughly 10x larger than a human's) but has a similar number of protein-coding genes. Its large size is due to the accumulation of repetitive DNA and transposable elements, not extra complexity.
Plants vs. Animals: Many flowering plants have enormous C values compared to mammals, yet they do not possess higher biological complexity.
Complexity is difficult to define. Is a single-celled algae complex because it can perform photosynthesis and respiration? Is a bacterium complex because of its unique metabolic pathways? While humans often define complexity through intelligence or nervous system development, the genome tells a different story: it shows that organisms can be "packing" massive amounts of non-functional DNA without increasing their functional capability.
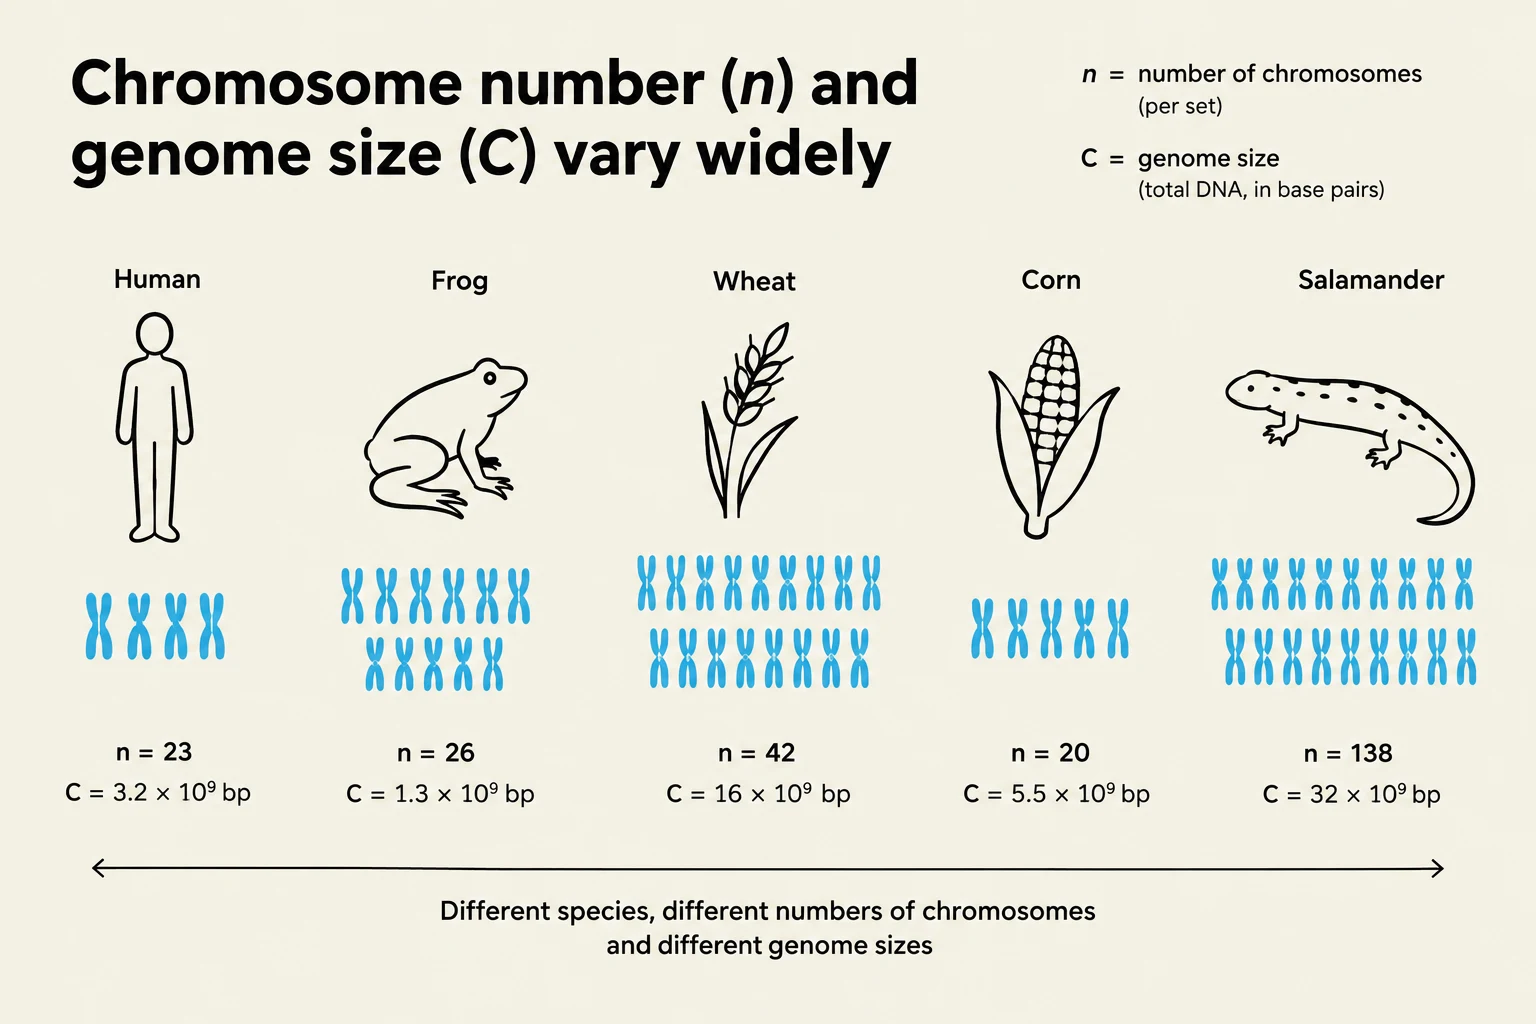
This illustration shows the variation in chromosome number (n) and genome size (C) across different species, including humans, frogs, wheat, corn, and salamanders. It defines n as the number of chromosomes per set and C as the total DNA in base pairs.
Summary Table: Quantifying the Genome
To master this topic, you must be able to distinguish between the following variables during different stages of the cell cycle:
Term
Symbol
Definition
Changes in Cell Cycle?
Ploidy
n
Number of unique chromosomes
No (stays constant)
Genome Size
C
Amount of DNA in one unique set
No (stays constant)
Copy Number
C coefficient
Number of genome copies present
Yes (increases during S phase)
Final Exam Prep: Practice calculating n and C values from karyotypes. Remember: to find n, count the number of unique centromeres. To find the C coefficient, count the number of sister chromatids in a single homologous group.
Keep reading for free.
Create an account to finish this reading and make it part of your study routine.