Public Health Indicator Frameworks: Process, Outcome, and Equity
This content explains the hierarchical framework of public health indicators, categorizing them into process, output, population outcome, and equity indicators. It details how these indicators are used to measure program activities, assess community health impact, and ensure fairness in health outcomes, with practical
In the field of public health, we cannot manage what we cannot measure. Health indicators serve as essential tools—both quantitative and qualitative—that allow us to understand a population's health status, evaluate the performance of health systems, and provide accountability for the use of public funds. By using standardized frameworks, such as the Ontario Public Health Standards, practitioners can move beyond simple observations to a structured analysis of how programs function, how they impact the community, and whether those impacts are distributed fairly.
The Public Health Indicator Framework
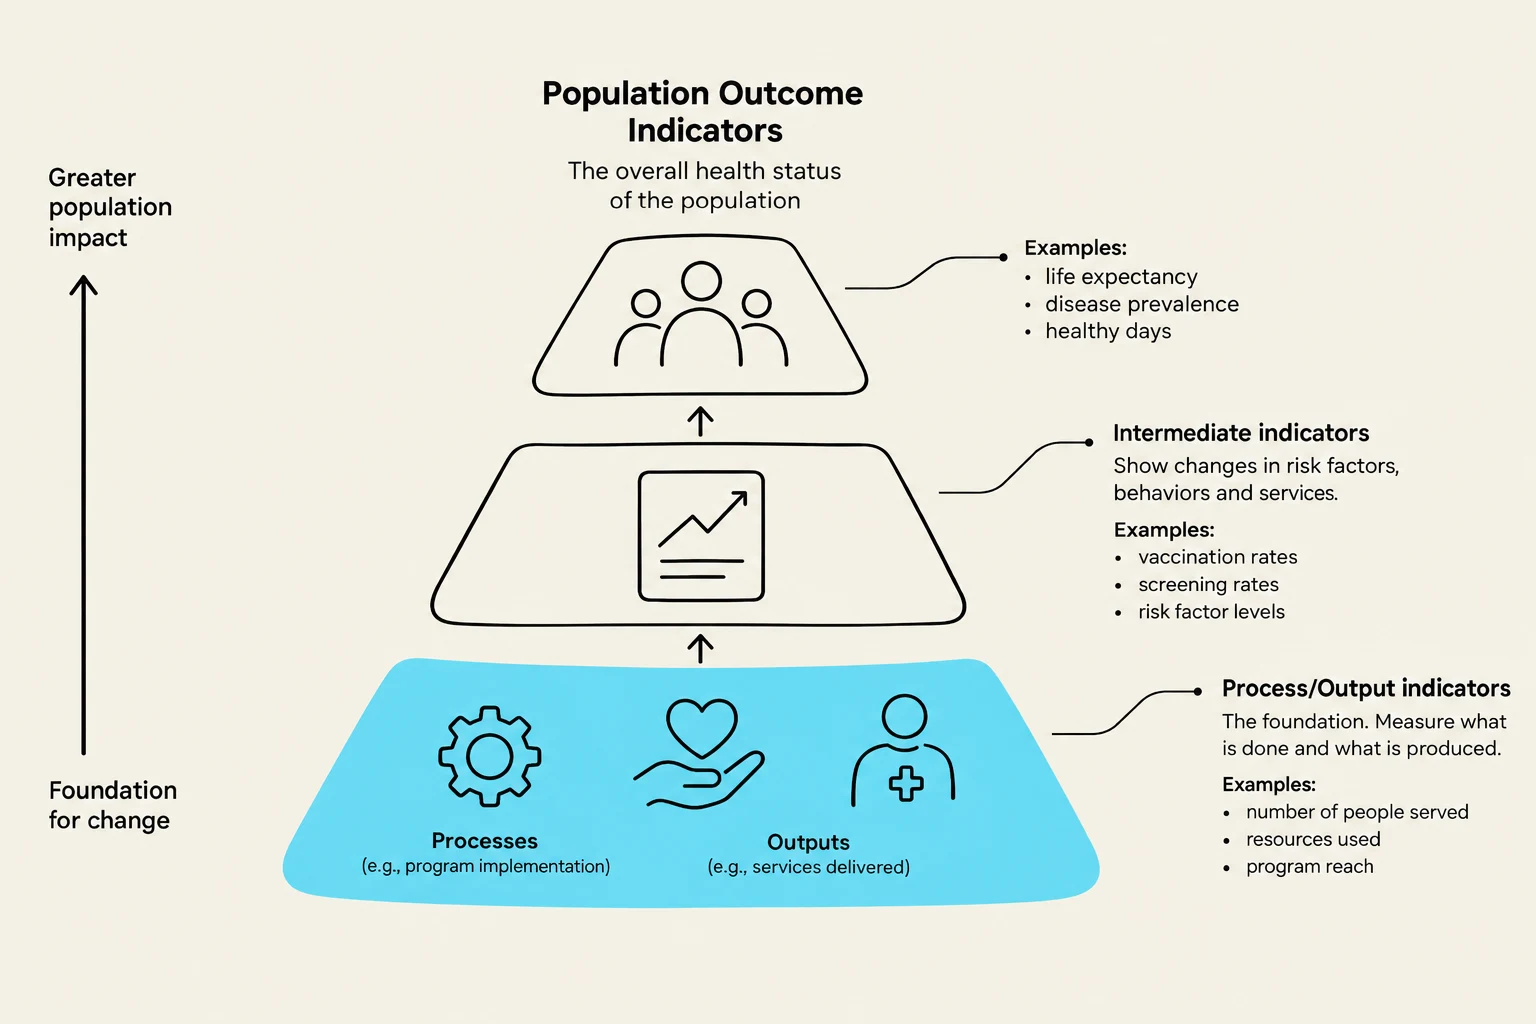
To effectively monitor health, indicators are organized into a hierarchical framework. This framework allows public health officials to see the "big picture" by connecting daily operational tasks to long-term societal goals. The relationship is progressive: if a program performs its tasks correctly (Process), it should lead to measurable changes in the community (Outcome), and these changes should be assessed to ensure no group is left behind (Equity).
This diagram illustrates population outcome indicators, categorized into population impact, intermediate indicators, and process/output indicators, with examples for each.
1. Process and Output Indicators: Measuring Activity
The first layer of the framework focuses on the "doing" phase of public health. These indicators answer the question: Is the program functioning as intended?.
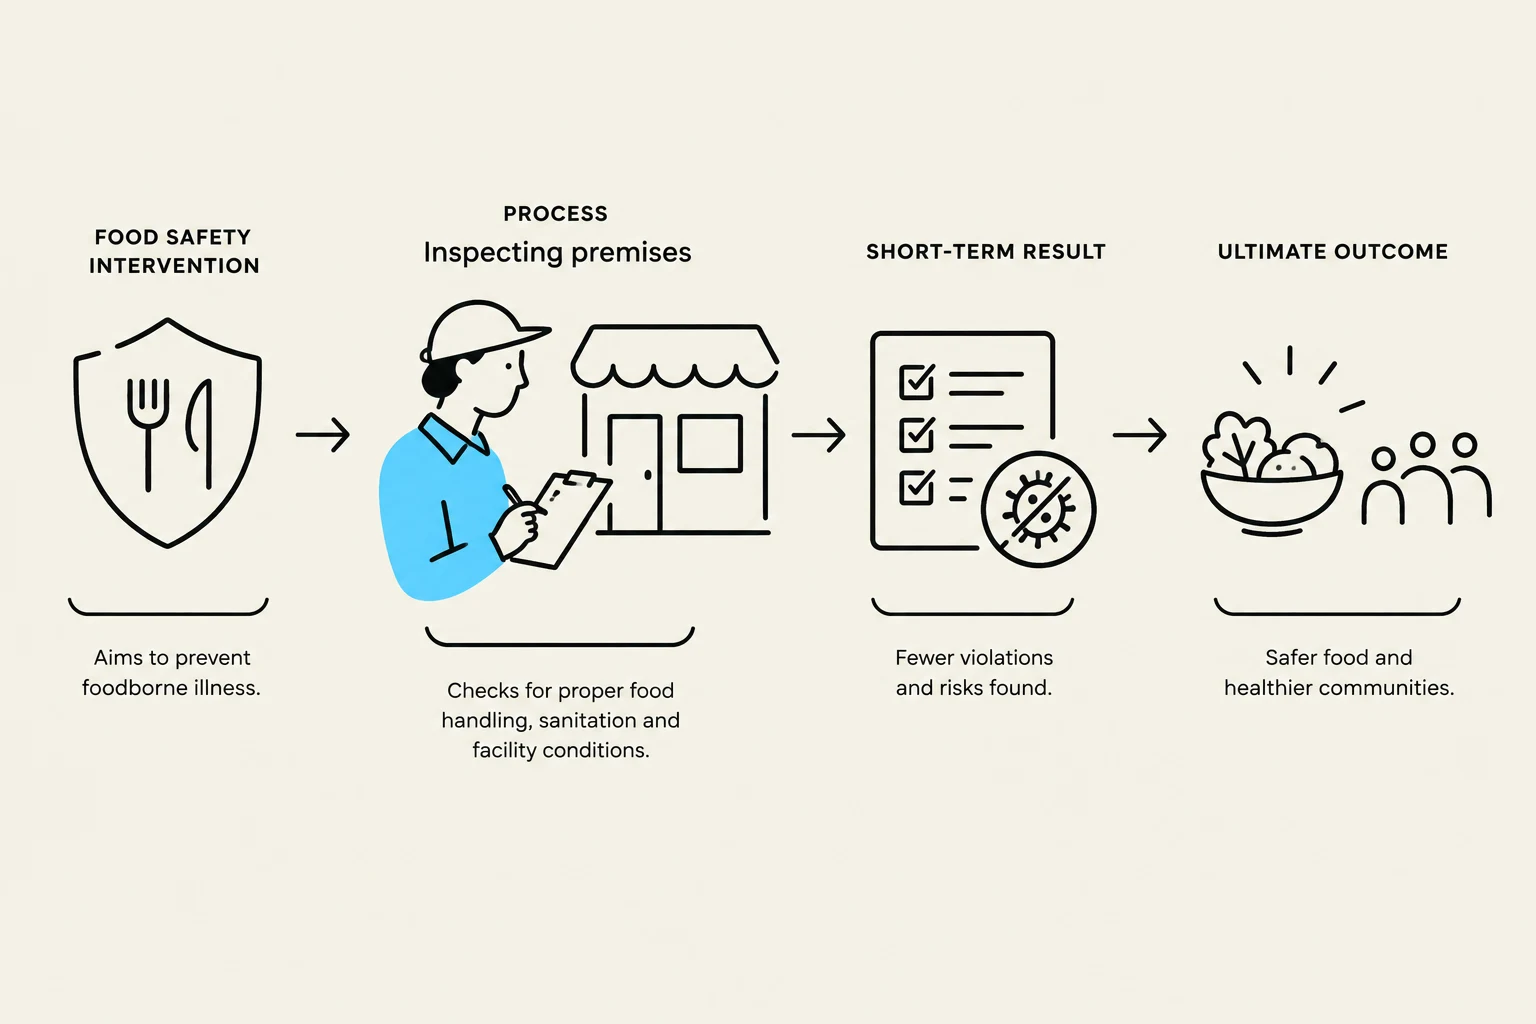
Process Indicators measure the specific activities and services being delivered. For example, in food safety, a process indicator might be the percentage of food premises re-inspected on schedule.
Output Indicators measure the immediate, tangible results of those activities, such as the total number of inspections conducted, the number of permits issued, or the number of violations cited and corrected.
In the context of Safe Water programs, process indicators might include the percentage of recreational pools re-inspected per year. While these metrics tell us if the workforce is busy and following protocols, they do not, by themselves, tell us if the community is actually getting healthier.
2. Population Outcome Indicators: Measuring Impact
The second layer shifts the focus from the program to the people. Population Outcome Indicators assess the broader impact of health interventions on the community at large. They answer the question: Did health, broadly, get better or worse?.
Key metrics in this category include:
Life expectancy: The average period a person is expected to live.
Incidence of reportable diseases: The number of new cases of diseases like Salmonella, E. coli, or Campylobacter within a specific timeframe.
General health trends: Such as water quality levels or the prevalence of chronic diseases.
For example, in a food safety program, while the process is the inspection, the population outcome is a decrease in the number of foodborne illness cases in the city.
This diagram illustrates the process of food safety intervention, starting with inspection of premises, leading to fewer violations and risks, and ultimately resulting in safer food and healthier communities.
3. Equity Indicators: Measuring Fairness
The most critical lens for modern public health is the Equity Indicator. Even if population outcomes are improving, those improvements may not be reaching everyone equally. Equity indicators measure whether health burdens, outcomes, or access to resources differ across various social, economic, or geographic groups.
It is vital to distinguish between inequality and inequity:
Health Inequality: Natural or inherent differences between groups (e.g., older adults generally having higher disease risks than younger people due to aging).
Health Inequity: Unfair, socially constructed barriers that prevent equal access to health (e.g., systemic barriers that prevent Indigenous communities from accessing safe drinking water).
To measure these inequities, public health uses specific tools:
Deprivation Index: A summary of socio-economic data for specific geographic areas, including income levels, employment rates, and marital status.
Relative Index of Inequality (RII): A tool used to compare the distribution of health outcomes (like chronic disease or substance use) across different social strata.
Exam Tip: When analyzing a case study, always ask: "Is this metric measuring the work being done (Process), the result in the community (Outcome), or the gap between groups (Equity)?"
Integrated Examples in Practice
To understand how these lenses overlap, consider these two real-world scenarios:
Case Study: Drinking Water
In many Indigenous communities, long-term water advisories have persisted for decades.
A Process indicator might track the number of water treatment facilities being maintained.
A Population Outcome indicator would track the total number of people with access to safe drinking water.
An Equity indicator would specifically compare the discrepancy in water quality and access between municipal populations and Indigenous communities.
Case Study: Substandard Housing
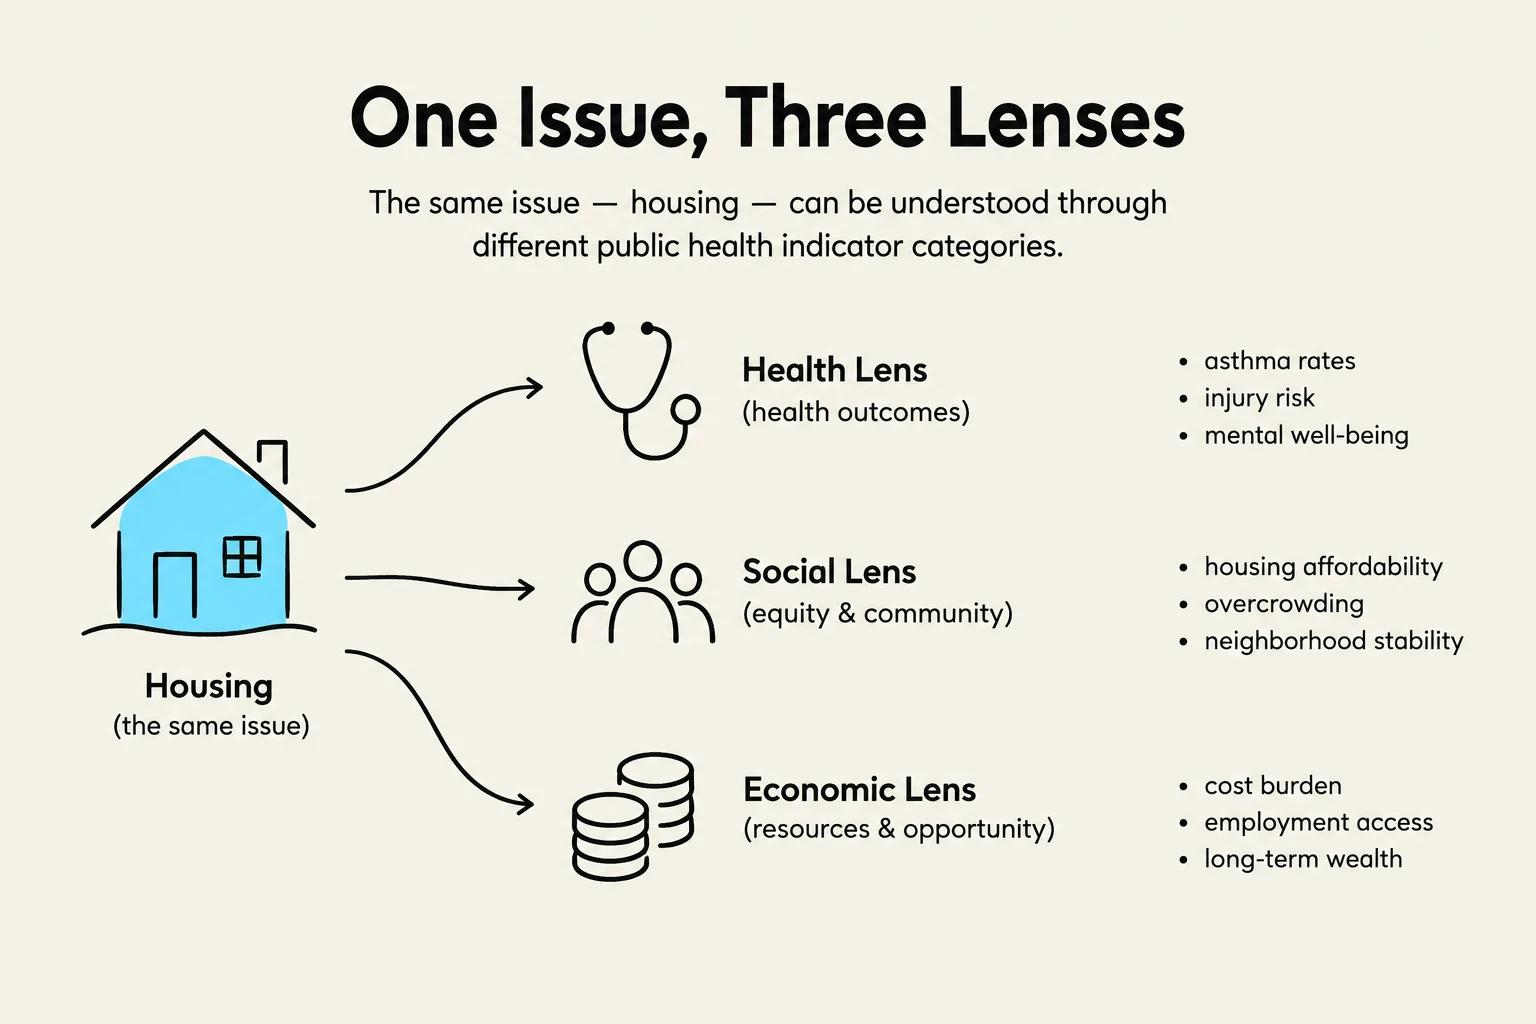
In rental housing, the relationship between affordability and quality is complex.
A Process indicator might be the number of mould complaints investigated by an officer.
A Population Outcome indicator might be the rate of respiratory symptoms among renters.
An Equity indicator would look at how housing violations correlate with immigration status, employment levels, or geographic location.
This diagram illustrates how the issue of housing can be viewed through three different public health lenses: Health, Social, and Economic, with examples of indicators for each.
Challenges and Data Limitations
Measuring these indicators is not without difficulty. Effective surveillance requires navigating significant data gaps:
Identity Gaps: Death records often fail to record Indigenous identity, making it difficult to calculate accurate life expectancy for those populations.
Inconsistency: Race-based data is not always collected routinely or consistently in Canadian health databases.
Complexity: Issues like intersectionality—where multiple systems of oppression (like racism and sexism) overlap—make it difficult to isolate the influence of a single factor on a health indicator.
To overcome these, public health professionals must adopt a strengths-based, nuanced, and reflexive approach, ensuring that data collection involves the communities being studied and respects their governance.
Keep reading for free.
Create an account to finish this reading and make it part of your study routine.