Public Health Data: Collection, Measurement, and Communication
Explore the methods of collecting, measuring, and communicating public health data. This includes understanding surveillance, population health status measures like HALE and DALYs, and evaluating information quality. Learn about graphical data presentation and psychological factors influencing risk perception in clinic
In the field of public health, information is more than just numbers on a page; it is the foundation upon which societies build safety, policy, and individual health choices. Health communication encompasses the methods used for collecting, compiling, and presenting health information. This process is cyclical, addressing how we perceive, combine, and ultimately use information to make critical decisions regarding our well-being.
Understanding this cycle requires looking at how data is gathered, how it is summarized to measure the health of entire populations, and how that information is communicated to both the public and clinicians.
Public Health Surveillance and Data Collection
To understand the health of a community, we rely on public health surveillance. This involves collecting and distributing population-level data without identifying specific individuals. While qualitative data is increasingly common, quantitative data remains the dominant force in public health.
Data is gathered through several distinct channels:
Single Case or Small Series: Reporting on rare or new diseases, such as anthrax or mad cow disease.
Vital Statistics: Official records of births, deaths, fetal deaths (after 20 weeks), marriages, and divorces, as well as reports of communicable diseases and abuse.
Surveys and Sampling: Large-scale systems like the National Health and Nutrition Examination Survey (NHANES), which includes physical exams and lab tests, and the Behavioral Risk Factor Surveillance System (BRFSS), the world's largest continuous telephone-based health survey.
Self-Reporting and Monitoring: This includes patients reporting adverse effects from drugs or vaccines, sentinel monitoring (such as tracking influenza outbreaks), and syndromic surveillance, which uses symptom patterns and over-the-counter drug sales to detect outbreaks early.
Social Media: Modern surveillance even utilizes data from social media to identify emerging outbreaks.
Measuring Population Health Status
Once data is collected, it must be synthesized into population health status measures—metrics that summarize the overall health of a group.
Traditional Mortality Measures
Common metrics include infant mortality, under-5 mortality, and life expectancy. While these provide a baseline, they do not always capture the full picture of how "well" a person is living.
Advanced Global Burden Measures
To provide a more nuanced view, organizations like the World Health Organization (WHO) use more complex measures:
Health-Adjusted Life Expectancy (HALE): This measures the average healthy years lived by adjusting life expectancy for illness and disability. For example, if life expectancy is 80 years but the quality of health is 90%, the HALE would be:
80×0.90=72 healthy years
HALE is vital for policymakers to understand the impact of chronic conditions and aging.
Disability-Adjusted Life Years (DALY): Used in the Global Burden of Disease (GBD) studies, DALYs measure the overall disease burden by combining years lost to premature death and years lived with disability. This helps governments prioritize resources by identifying whether the primary burden comes from communicable diseases, noncommunicable diseases, or injuries.
Evaluating and Communicating Information
Not all health information is created equal. As health literacy levels vary across society, the ability to evaluate information becomes a critical skill.
Quality and Accuracy
When evaluating online health information, one should check the author, the timeliness, the relevance, and whether the site cites proper sources. We must also distinguish between different types of information errors:
Incomplete information: Accurate data that fails to provide the full context.
Misinformation: Inaccurate or false information that a user believes to be true.
Disinformation: Incorrect information that is intentionally presented to encourage specific actions.
Exam Tip: Pay attention to how the same data can be framed differently. For example, a change from 20% to 25% in sleep deprivation can be presented as a "25% increase" (relative change) or "1 in 4 adults" (proportion), which can drastically change the perceived urgency of a public health message.
Visualizing Data
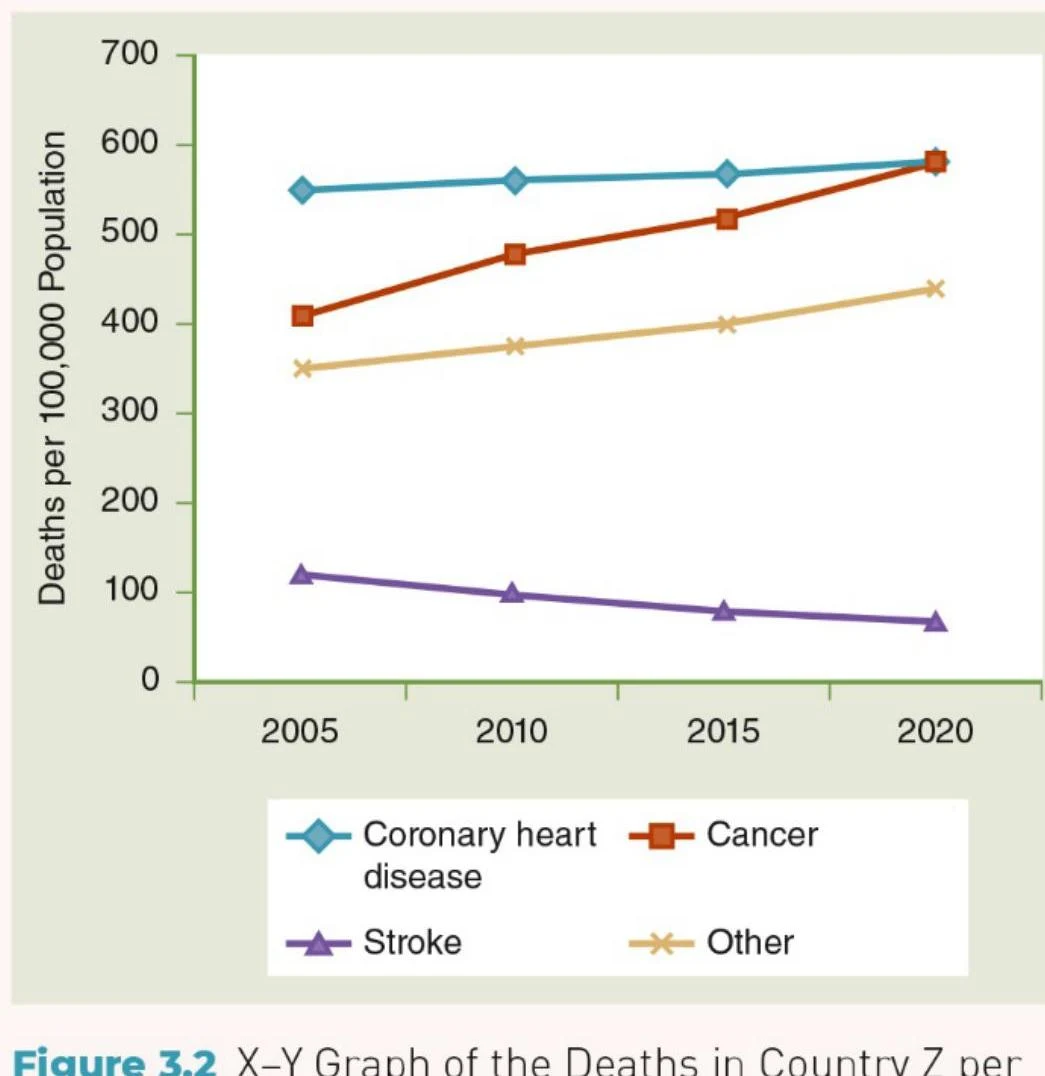
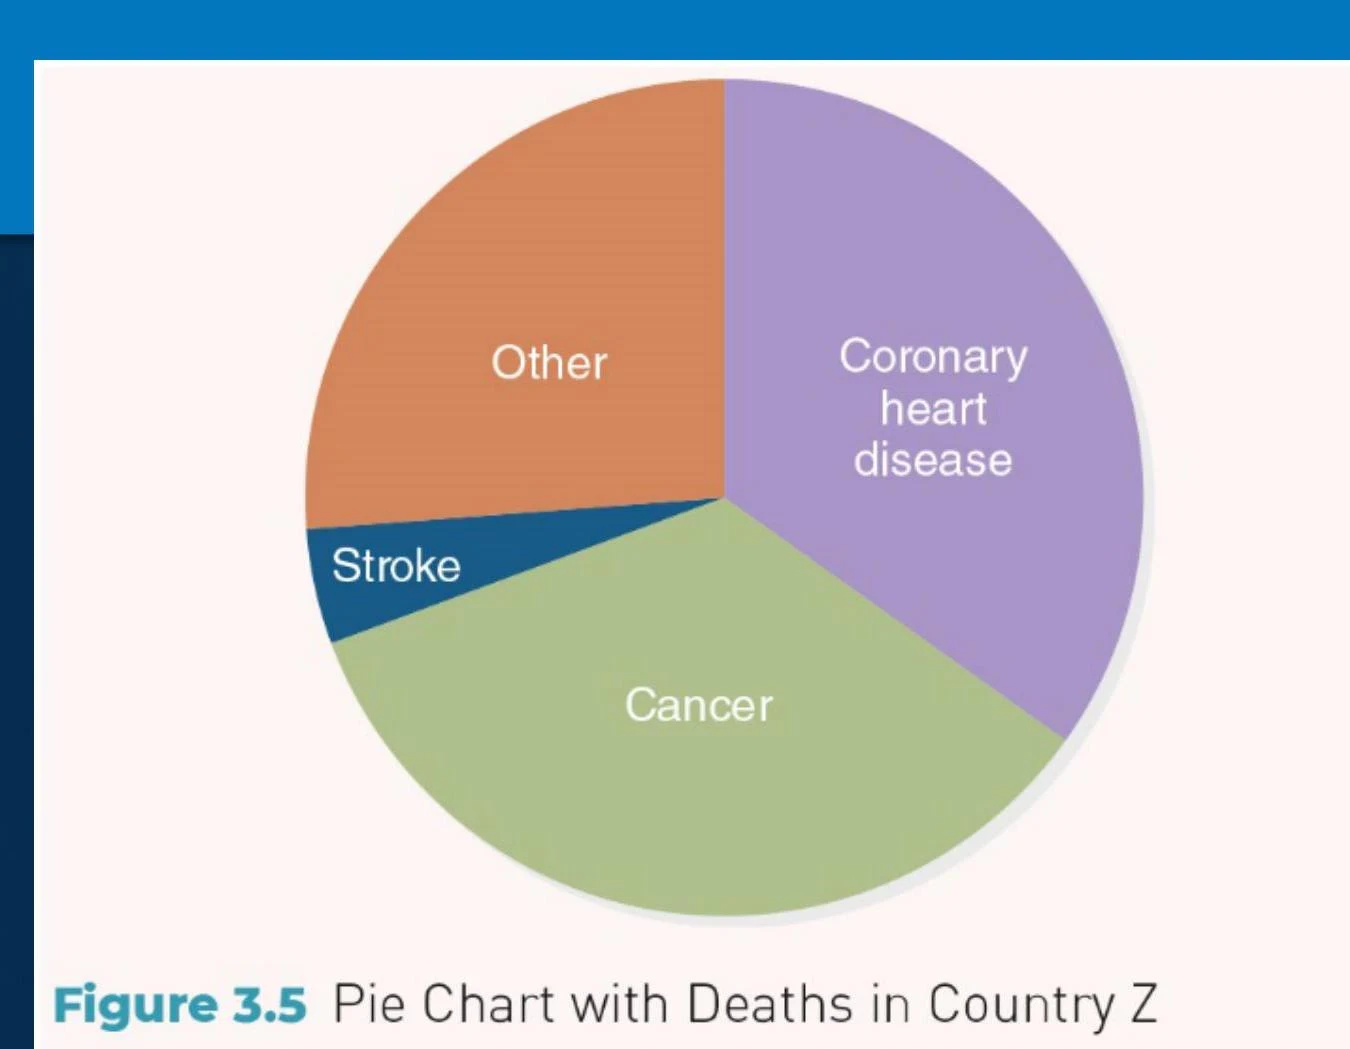
Effective communication often requires graphical presentation. Common forms include X-Y graphics, geometric graphics, and pie charts.
X-Y Graph of the Deaths in Country Z per 100,000 Population from 2005 to 2020 for Coronary Heart Disease, Cancer, Stroke, and Other causes.Figure 3.2 X-Y Graph of the Deaths in Country Z per 100,000 Population.
Bar chart showing deaths per 100,000 population for Coronary heart disease, Cancer, Stroke, and Other causes in the years 2005, 2010, 2015, and 2020.Figure 3.5 Column Chart of Deaths in Country Z per 100,000 Population.
Pie chart illustrating causes of death in Country Z, including Coronary heart disease, Cancer, Stroke, and Other.Figure 3.5 Pie Chart with Deaths in Country Z.
Perception and Clinical Decision-Making
How we interpret data is often influenced by psychological biases. Three specific effects can alter our perception of risk:
Dread effect: We fear hazards that produce highly visual or gruesome consequences.
Unfamiliarity effect: We feel more fear toward hazards we have no personal experience with.
Uncontrollability effect: We perceive hazards that are out of our control as more threatening.
Decision-Making in Healthcare
In clinical settings, health information is used to guide patient care through three primary approaches:
Inform of decision: The clinician holds all essential information and makes the decision in the patient's best interest.
Informed consent: A crucial ethical requirement where patients must understand the risks, benefits, and alternatives of a treatment to provide permission. This practice stems from a need to protect vulnerable populations and provide patient agency, following historical ethical failures like the Tuskegee Syphilis Study.
Shared decision-making: A collaborative approach where the clinician provides evidence-based information, and the patient makes a decision based on that evidence combined with their own personal values and priorities.
Keep reading for free.
Create an account to finish this reading and make it part of your study routine.