


In microeconomic theory, understanding how consumers make choices requires a way to map their preferences. This is achieved through the concept of indifference curves. An indifference curve represents all combinations of two goods (typically labeled and ) that provide a consumer with the exact same level of satisfaction or utility. Because every point on a single curve yields the same utility, the consumer is "indifferent" between any of the bundles represented on that curve.
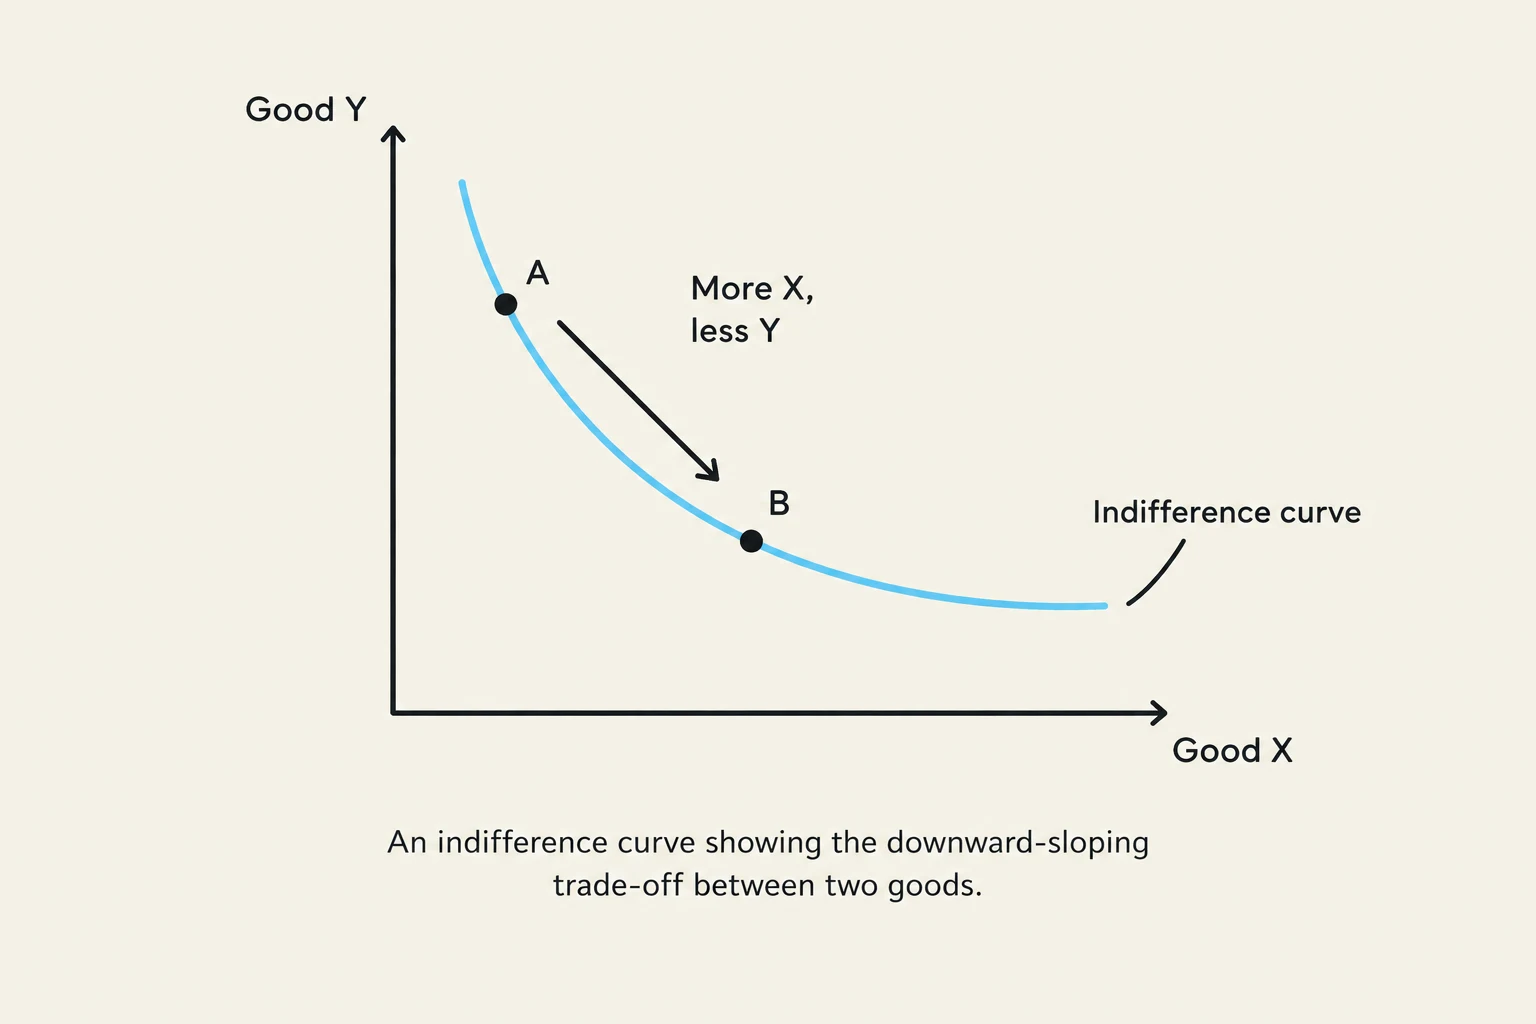
While there are many types of preference models, standard consumer theory focuses on curves that exhibit specific geometric properties: they are downward-sloping and convex to the origin. These shapes are not arbitrary; they are rooted in the logic of compensation and the diminishing marginal utility of goods.
The Downward-Sloping Property and Compensation
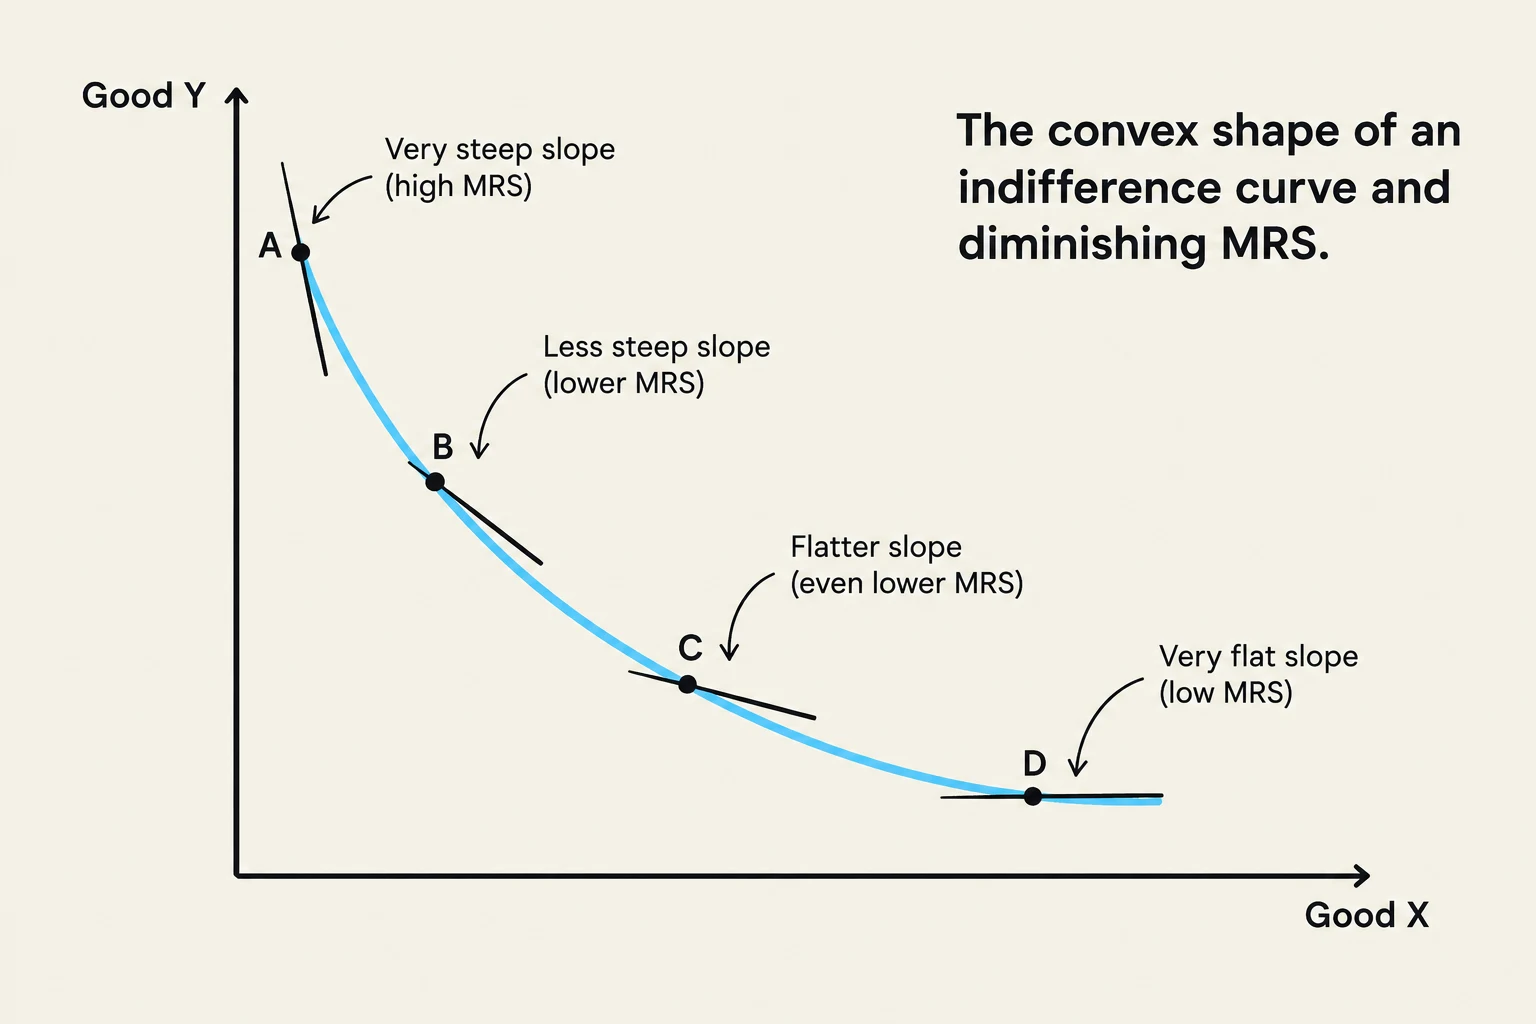
If a consumer is given more of good , their total utility increases. To keep their level of satisfaction constant (to stay on the same indifference curve), they must be given less of good . This trade-off is known as compensation.
As shown in the diagram above, moving from Point A to Point B involves "taking away" some of good and "giving more" of good . The amount of added must exactly compensate for the loss of to ensure the consumer remains just as satisfied as they were at Point A.
Keep reading for free.
Create an account to finish this reading and make it part of your study routine.
Continue reading freeAlready have an account? Log in
Updated