Production Possibilities Frontier and Opportunity Cost in Economics
Explore the Production Possibilities Frontier (PPF) as a tool to visualize economic trade-offs and understand opportunity cost. Learn how the slope of the PPF quantifies the cost of producing more of one good by sacrificing another, with examples comparing production capabilities.
In the study of microeconomics, we often encounter the fundamental problem of scarcity: resources are limited, but human wants are not. Because we cannot produce an infinite amount of everything, every choice to produce more of one good necessitates a sacrifice of another. To visualize this trade-off, economists use a powerful tool known as the Production Possibilities Frontier (PPF). By understanding the PPF, we can quantify the "cost" of our decisions through the concept of opportunity cost.
The Production Possibilities Frontier (PPF)
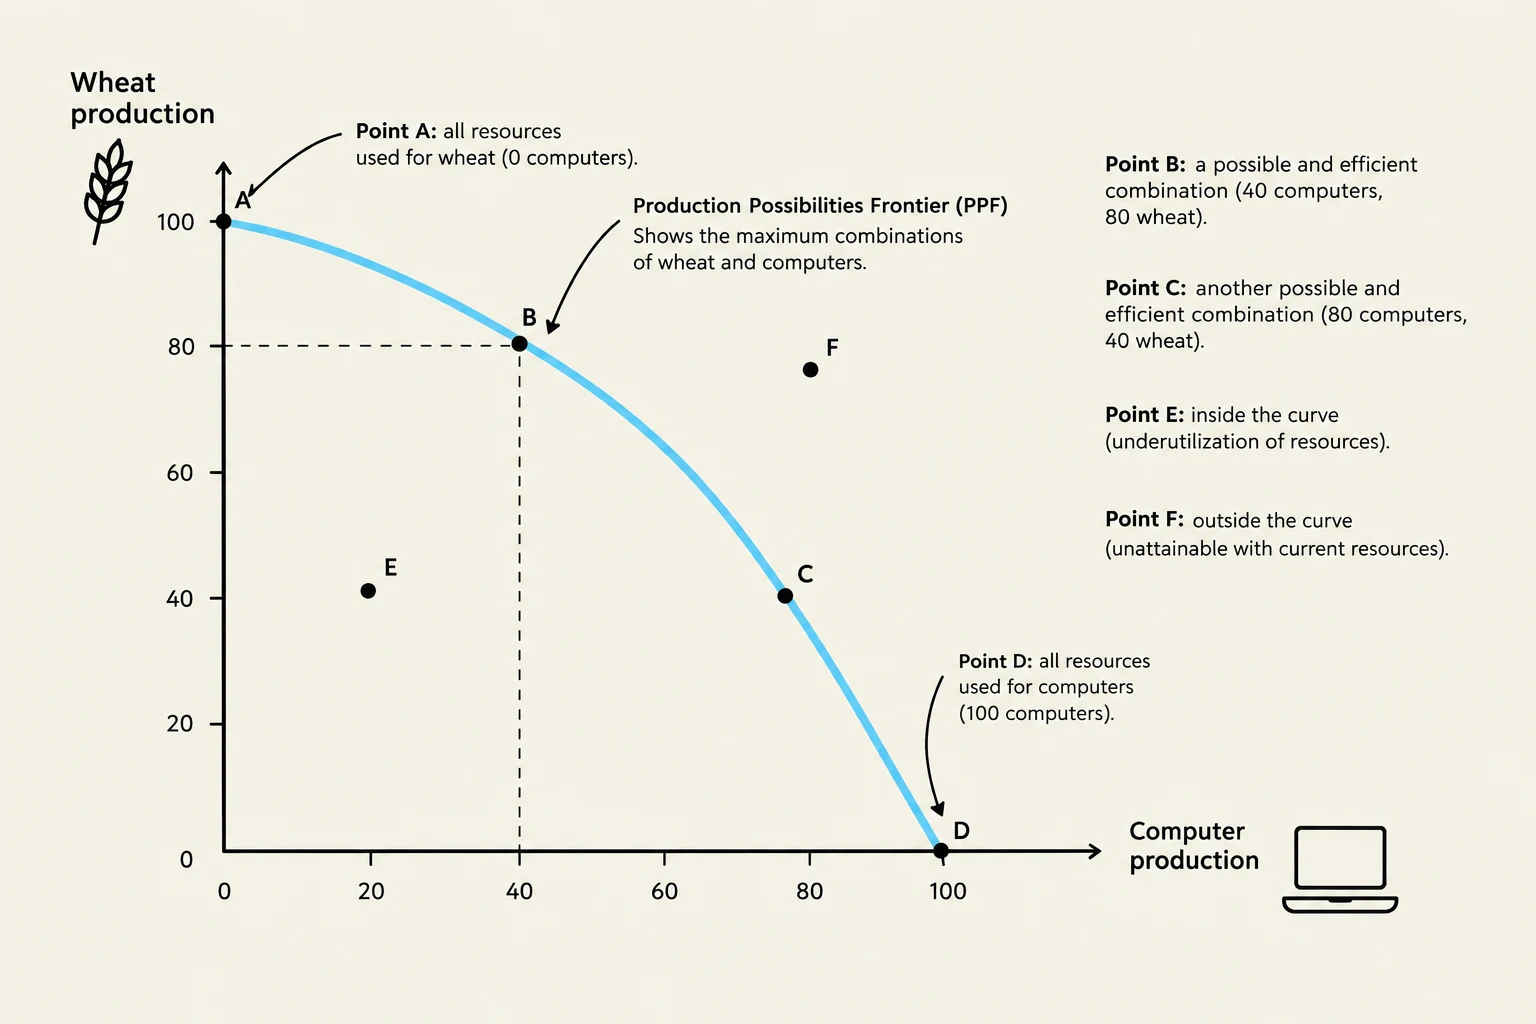
The Production Possibilities Frontier (PPF) is a graphical representation that shows the maximum possible combinations of two goods an economy can produce given its available resources and technology. When an economy is operating on the frontier, it is considered efficient, meaning it is using all its resources to their fullest potential.
To understand how this works in practice, let's look at a hypothetical economy that produces two different goods: Wheat and Computers. If the economy decides to shift its resources away from agriculture and toward technology, the total amount of wheat produced must decrease.
This graph illustrates the Production Possibilities Frontier (PPF), which shows the maximum combinations of two goods, wheat and computers, that can be produced with available resources. Points on the curve represent efficient production, points inside represent underutilization of resources, and points outside are unattainable with current resources.
Calculating Opportunity Cost via the Slope
The most critical takeaway from a PPF graph is the slope. In economics, the slope of the PPF represents the opportunity cost of producing one additional unit of a good.
When the PPF is a straight line, it indicates that the opportunity cost remains constant regardless of how much of a good is being produced. We can calculate this using the standard slope formula:
slope=ΔXΔY
For example, consider a scenario where an economy can produce either 6,000 tons of wheat or 600 computers. If we look at the rate of change between these two points, the calculation might look like this:
slope=100 (com.)−1000 (wheat)=−10com.wheat per com.
This result tells us that the opportunity cost of producing one extra computer is 10 tons of wheat. In other words, to get one more computer, you must "give up" the production of 10 tons of wheat.
Exam Tip: The Inverse Relationship
Remember that opportunity cost works both ways. If the cost of 1 computer is 10 tons of wheat, the cost of 1 ton of wheat is the reciprocal: 1/10 of a computer. Always check which good is on which axis before calculating!
Comparing Comparative Advantage: France vs. England
We can apply these principles to compare different countries to see who has a "lower" opportunity cost for a specific good. This is the foundation of international trade theory.
Let's examine two countries, France and England, and their ability to produce Wine and Cloth.
This image illustrates the concept of Production Possibility Frontiers (PPF) for France and England, comparing their production capabilities for wine and cloth. It demonstrates how different resource endowments lead to different PPFs and comparative advantages.
Case Study Analysis
France's PPF: France can produce up to 600 units of Wine or 400 units of Cloth.
England's PPF: England can produce up to 200 units of Wine or 300 units of Cloth.
To determine in which country the opportunity cost of cloth is lower, we must calculate how much wine is sacrificed to produce cloth in each nation.
For France:
To get 400 units of cloth, they give up 600 units of wine.
Opportunity Cost of 1 Cloth (France)=400 Cloth600 Wine=1.5 units of Wine
For England:
To get 300 units of cloth, they give up 200 units of wine.
Opportunity Cost of 1 Cloth (England)=300 Cloth200 Wine≈0.67 units of Wine
By comparing these two, we can see that England has a lower opportunity cost for producing cloth because it sacrifices less wine per unit of cloth than France does.
This illustration compares a steeper Production Possibility Frontier (PPF) with a flatter PPF, explaining how the slope represents the opportunity cost of producing one good in terms of another.
Summary Table of Concepts
Concept
Definition
Economic Significance
PPF
A curve showing maximum production combinations.
Represents scarcity and efficiency.
Opportunity Cost
The value of the next best alternative foregone.
The "real" cost of any economic decision.
Slope
The ratio of change between two goods (ΔY/ΔX).
Quantifies the opportunity cost.
Production
The process of turning resources into goods.
Limited by the boundaries of the PPF.
Through these principles, we can see that economics is not just about money, but about the fundamental trade-offs required by a world of limited resources.
Keep reading for free.
Create an account to finish this reading and make it part of your study routine.