


Probability is the numerical value representing the odds of outcomes occurring from experiments or activities. In business and economics, probabilistic predictions are essential tools used to reduce uncertainty, such as estimating the likelihood of a new business succeeding or a stock investment being profitable.
To understand how these probabilities work, we must first understand the mathematical language used to describe them. Probability theory utilizes set theory concepts to illustrate the relationships between different events. By using tools like Venn diagrams, we can visualize how events overlap or remain entirely separate.
The Building Blocks: Sample Spaces and Events
Before calculating probabilities, we must define the "playground" where the events occur. The sample space represents all possible outcomes of an experiment. An event is a specific outcome or a collection of outcomes within that sample space.
A critical concept here is the complement. If we have an event (for example, tossing a coin and getting heads), the complement, denoted as $A'$, consists of all sample points that are not in (in this case, getting tails).
Fundamental Rule: For any probability assignment to be valid, the probability of each outcome must be between 0 and 1, and the sum of all possible outcomes in the sample space must equal 1.0.
Set Relationships: Union and Intersection
When we look at two different events, and , we are often interested in how they relate to one another. We use two primary set operations to describe these relationships: Union and Intersection.
Union of A and B
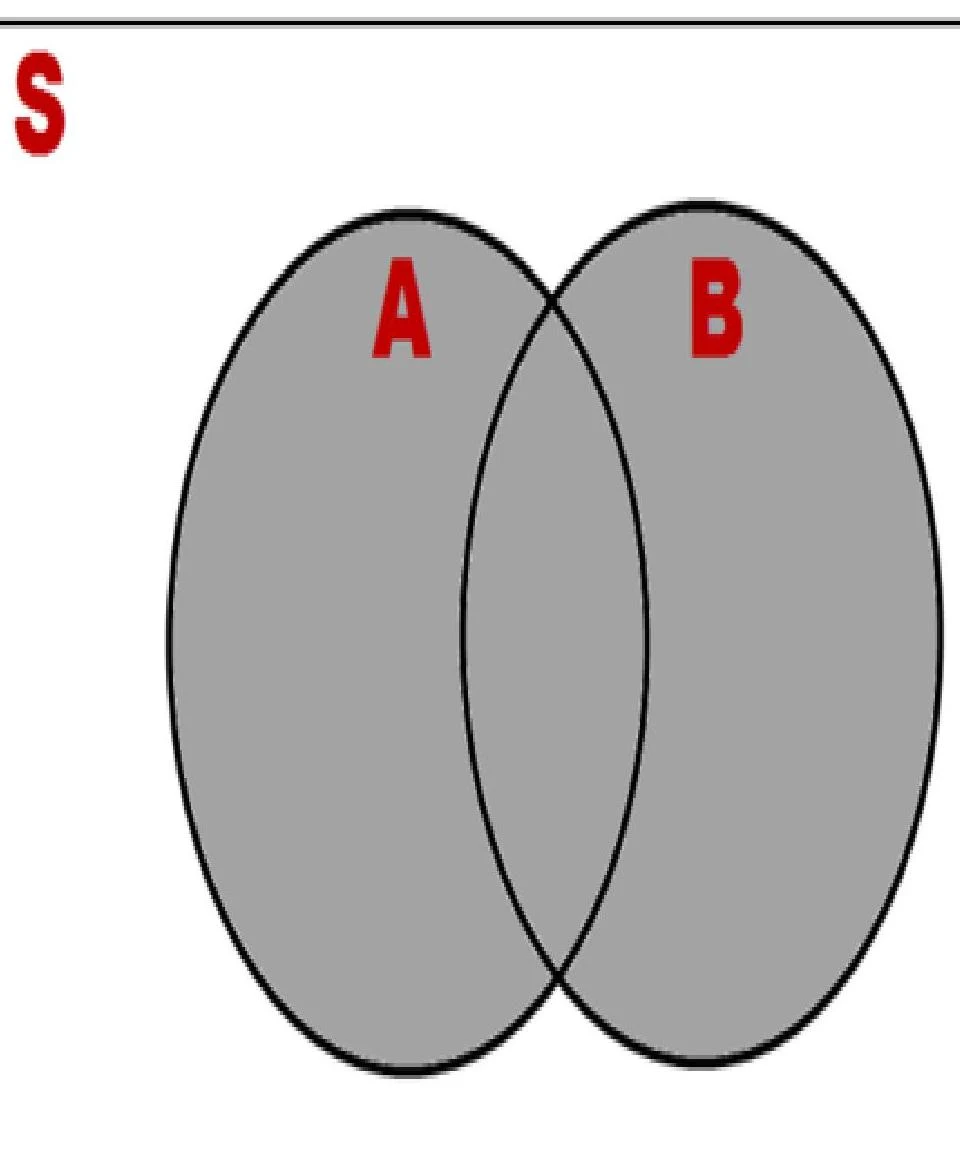
The union of and , denoted as , is the event containing all sample points that belong to , or to , or to both. In a Venn diagram, this is represented by the entire area covered by both circles.
Keep reading for free.
Create an account to finish this reading and make it part of your study routine.
Continue reading freeAlready have an account? Log in
Updated