Learn the fundamental principles of restriction mapping, including understanding DNA topology, restriction enzyme digestion patterns, and applications in recombinant DNA technology for determining cloned insert orientation.
In molecular biology, knowing the exact sequence of a DNA molecule is vital, but often we only need to know the relative positions of specific landmarks. This is where restriction mapping becomes essential. By using restriction enzymes to cut DNA at specific recognition sites, scientists can create a "map" of the molecule, allowing them to identify recombinant products, verify cloning success, and determine the orientation of inserted DNA fragments.
Understanding DNA Topology and Electrophoresis
Before mapping a plasmid, one must understand how different forms of DNA behave during electrophoresis. DNA molecules are typically categorized by their shape: circular or linear.
Circular vs. Linear DNA
When analyzing a plasmid via gel electrophoresis, you might see multiple bands even if you only have one type of molecule. This is because plasmids can exist in different topological states: open circular (nicked), linear, and closed circular (supercoiled).
Illustration showing different forms of DNA: open circular, linear, and closed circular.
Measuring Fragment Size
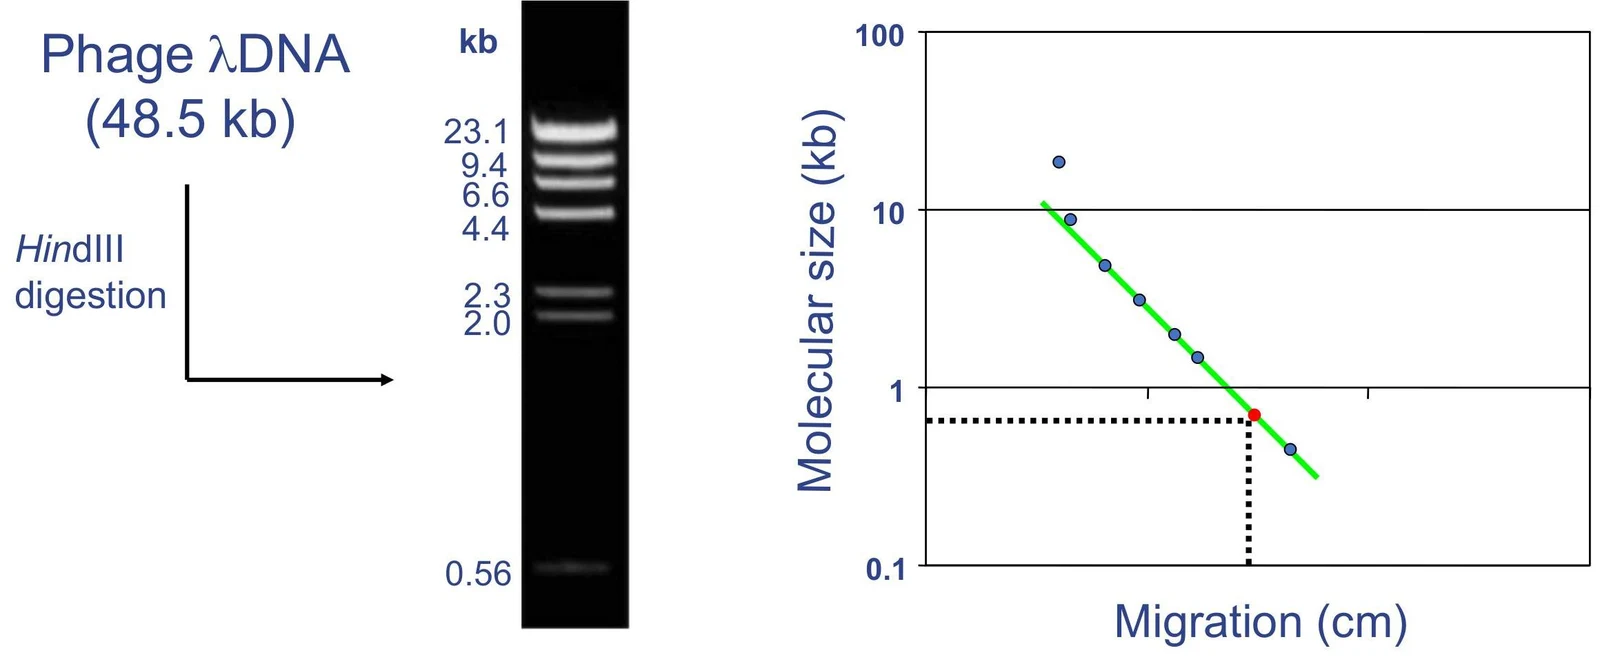
To turn the visual bands on a gel into meaningful data (kilobases or base pairs), we use a molecular size standard curve. By running a DNA ladder (a mixture of fragments of known sizes) alongside your sample, you can plot the migration distance against the log of the molecular weight to estimate the size of your unknown fragments.
This image illustrates DNA gel electrophoresis, showing a DNA ladder with known fragment sizes and a graph plotting molecular size against migration distance. The process involves digesting phage lambda DNA and then separating the fragments by size.
Restriction Digestion Patterns
The core of restriction mapping lies in the predictable way restriction enzymes interact with recognition sites. The number of bands you see on a gel depends on two factors: the shape of the DNA and the number of sites the enzyme cuts.
Single vs. Double Digestion
A "single digestion" uses only one enzyme, while a "double digestion" uses two different enzymes simultaneously.
For a circular plasmid, the relationship between the number of sites and the number of bands is as follows:
One site: Results in one band (the circle is cut once and becomes a linear piece).
Two sites: Results in two bands.
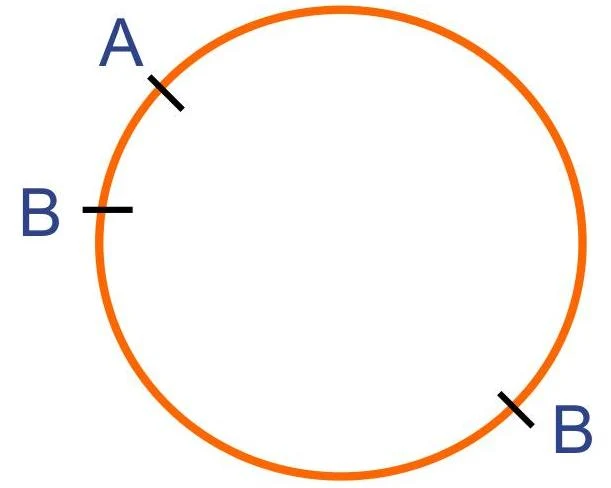
Double digestion: If enzyme A has one site and enzyme B has two sites, a double digest might result in three bands.
A diagram showing a circle with points labeled A and B.
Note on Linear DNA: Unlike circular DNA, a linear DNA molecule with n restriction sites will produce n+1 fragments. For example, one site in a linear molecule produces two fragments.
Applications: Recombinant DNA and Orientation
Restriction mapping is a primary tool for verifying recombinant DNA products. When a piece of foreign DNA (an insert) is cloned into a plasmid vector, we need to know two things: if the insert is there, and which way it is facing.
Identifying Recombinant Products
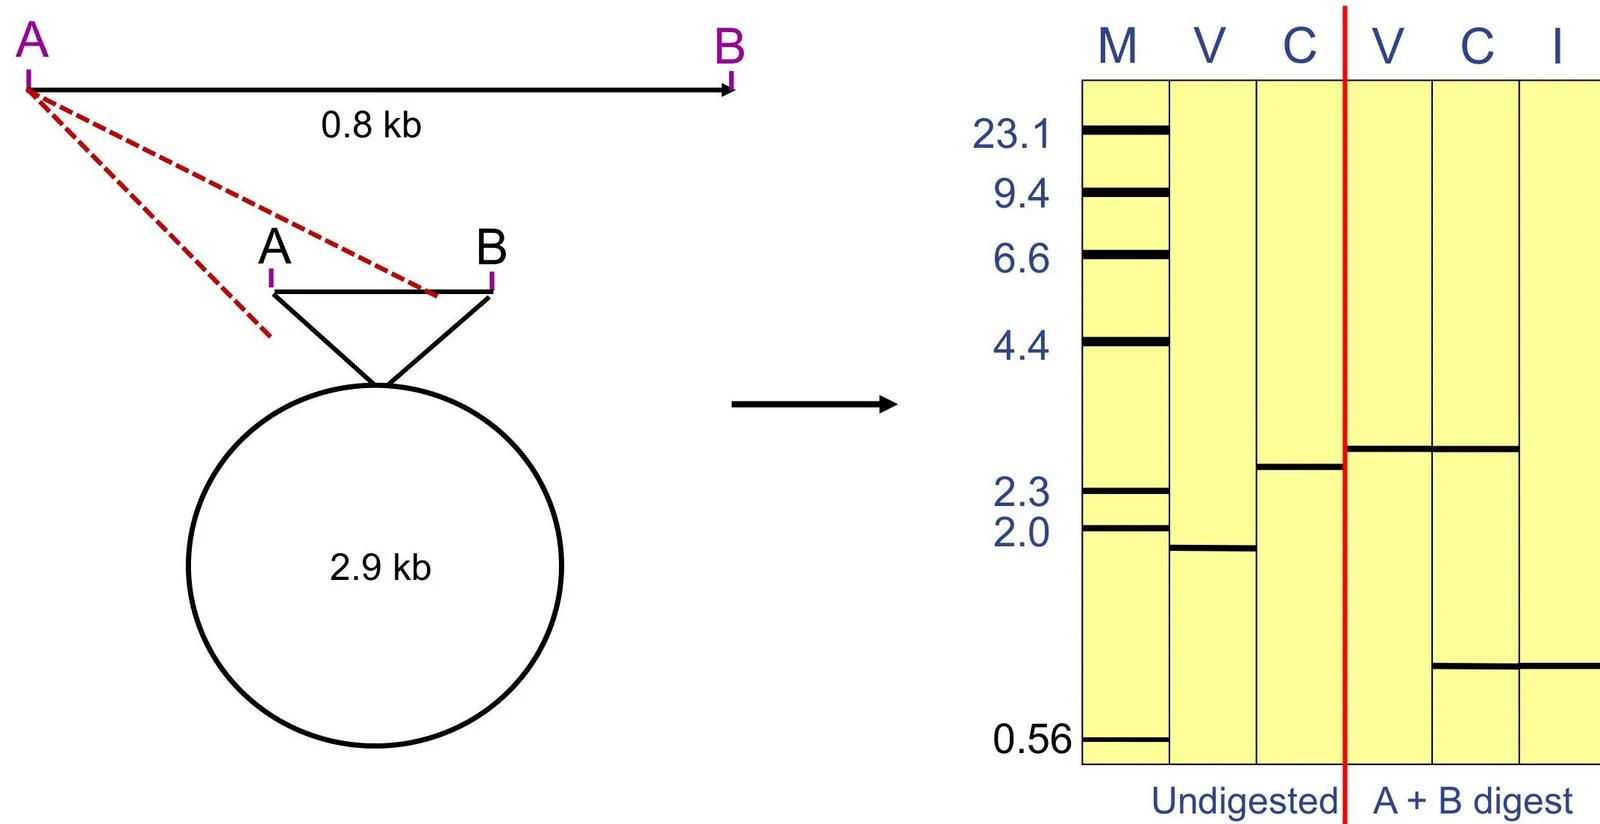
By comparing the digestion pattern of an empty vector to a suspected recombinant plasmid, we can confirm the presence of the insert.
Diagram illustrating DNA digestion and gel electrophoresis results. The left side shows a circular DNA molecule of 2.9 kb and a linear DNA fragment of 0.8 kb, with restriction sites A and B indicated. The right side displays a gel electrophoresis result, comparing undigested DNA with DNA digested by enzymes A and B, showing fragment sizes in kilobases (kb).
Determining Cloned Insert Orientation
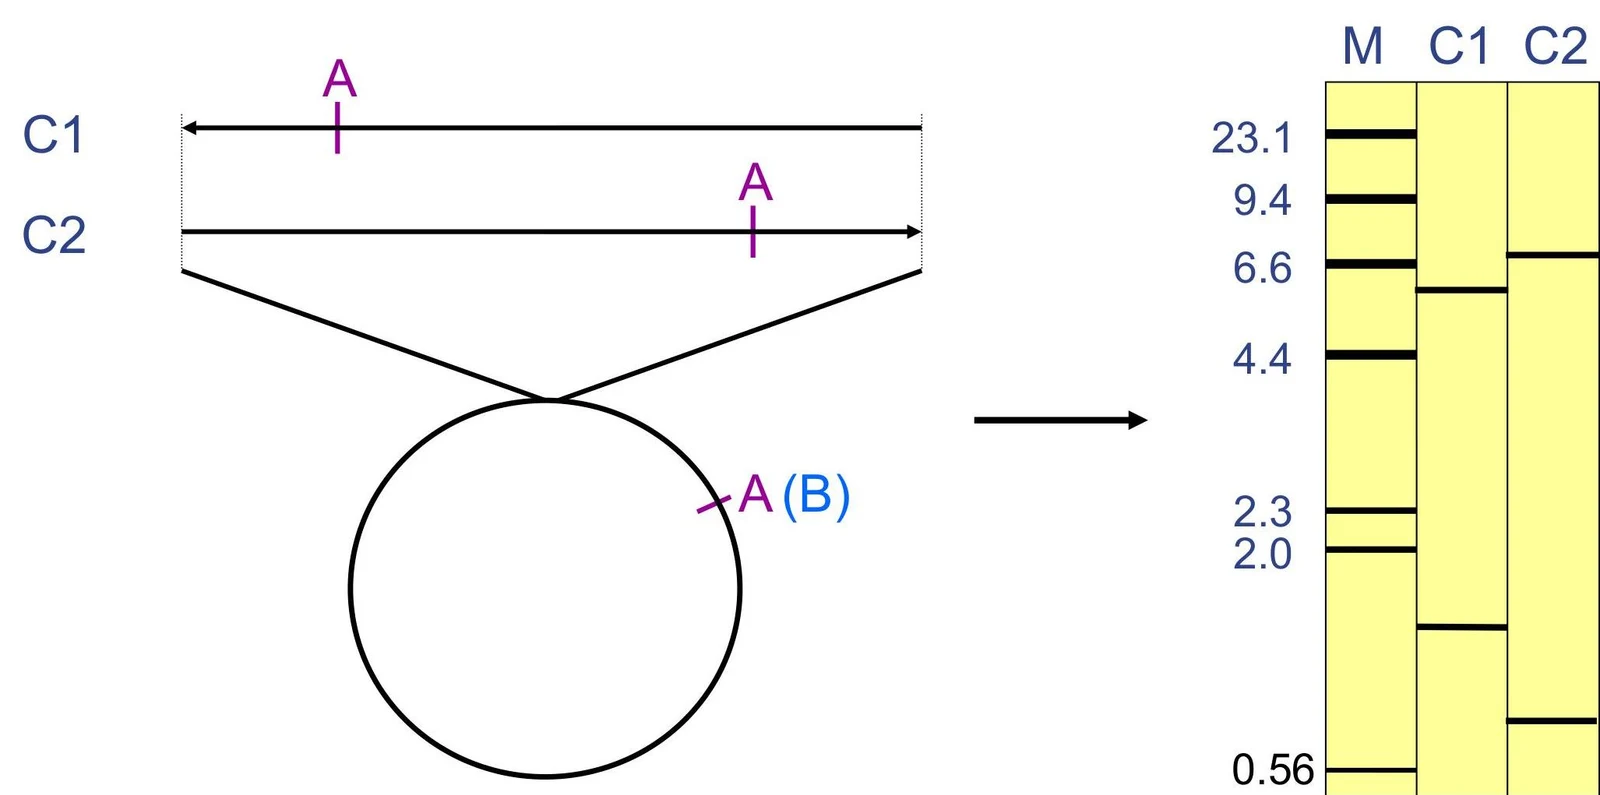
In many experiments, the direction of the insert is critical (e.g., for protein expression). We can determine the cloned insert orientation by using enzymes that cut asymmetrically within the insert or by using an enzyme that cuts once in the vector and once in the insert.
This diagram illustrates DNA restriction fragment analysis. Two DNA samples, C1 and C2, are shown with restriction sites labeled 'A'. The circular DNA is cut by restriction enzymes, and the resulting fragments are separated by gel electrophoresis, visualized in lanes M (marker), C1, and C2. The banding patterns indicate fragment sizes, with numerical labels representing kilobases.
Worked Examples and Mapping Principles
When drawing a map from gel data, you must use logic to piece the fragments together like a puzzle.
Example 1: Solving a Double Digest
Suppose you have a circular plasmid and perform the following digests:
Enzyme A: Produces fragments of 2 kb and 6 kb (Total size = 8 kb).
Enzyme B: Produces fragments of 2 kb and 6 kb (Total size = 8 kb).
Double Digest (A+B): Produces fragments of 1, 2, and 5 kb (Wait, let's look at the provided data).
Actual Data Example from Source:
A: 2, 6 kb
B: 2, 3 kb (This implies a total size of 5 kb)
A+B: 1, 2, 3 kb (Wait, let's check the math)
Let's use the specific logic provided in the text:
If A gives 2 and 6 kb, the total is 8 kb. If B gives 2 and 3 kb, the total is 5 kb. This suggests the enzymes are being used on different templates or the math must be consistent. In a proper mapping exercise, the sum of fragments in a single lane must always equal the total size of the plasmid.
Essential Principles for Success
To avoid errors when drawing maps, keep these rules in mind:
The Sum Rule: The sum of all fragment sizes in a lane must equal the total size of the DNA molecule.
Coinciding Sites: Two different restriction sites might actually be at the same location on the map.
Overlapping Sizes: Two different fragments might be the exact same size, causing them to migrate to the same position and appear as a single, darker band on the gel.
Multiple Maps: Given a limited set of data, there may be more than one mathematically possible map. If two maps can be superimposed (rotated) to look identical, they are considered the same map.
Exam Tip: If you are asked to find the total size of a plasmid, always sum the fragments from a single-digest lane. If the double-digest fragments don't sum to that same total, re-check your math or look for "hidden" bands of the same size.
Keep reading for free.
Create an account to finish this reading and make it part of your study routine.