Pricing, Profitability, and Cost Analysis for Businesses
This article explains fundamental business concepts like price, variable cost, fixed cost, and volume, and how they relate to profit. It details key metrics such as unit contribution, contribution margin, and markup, and demonstrates their application through a car wash case study. The content also covers break-even an
Understanding the relationship between price, volume, and profit is a fundamental skill for any business manager. Whether you are running a single-site car wash or a global corporation, the math governing your profitability remains consistent. This article uses the Hilltop Express Car Wash case study to explore how small changes in pricing can lead to massive shifts in the required sales volume and overall business health.
The Fundamentals of Profitability
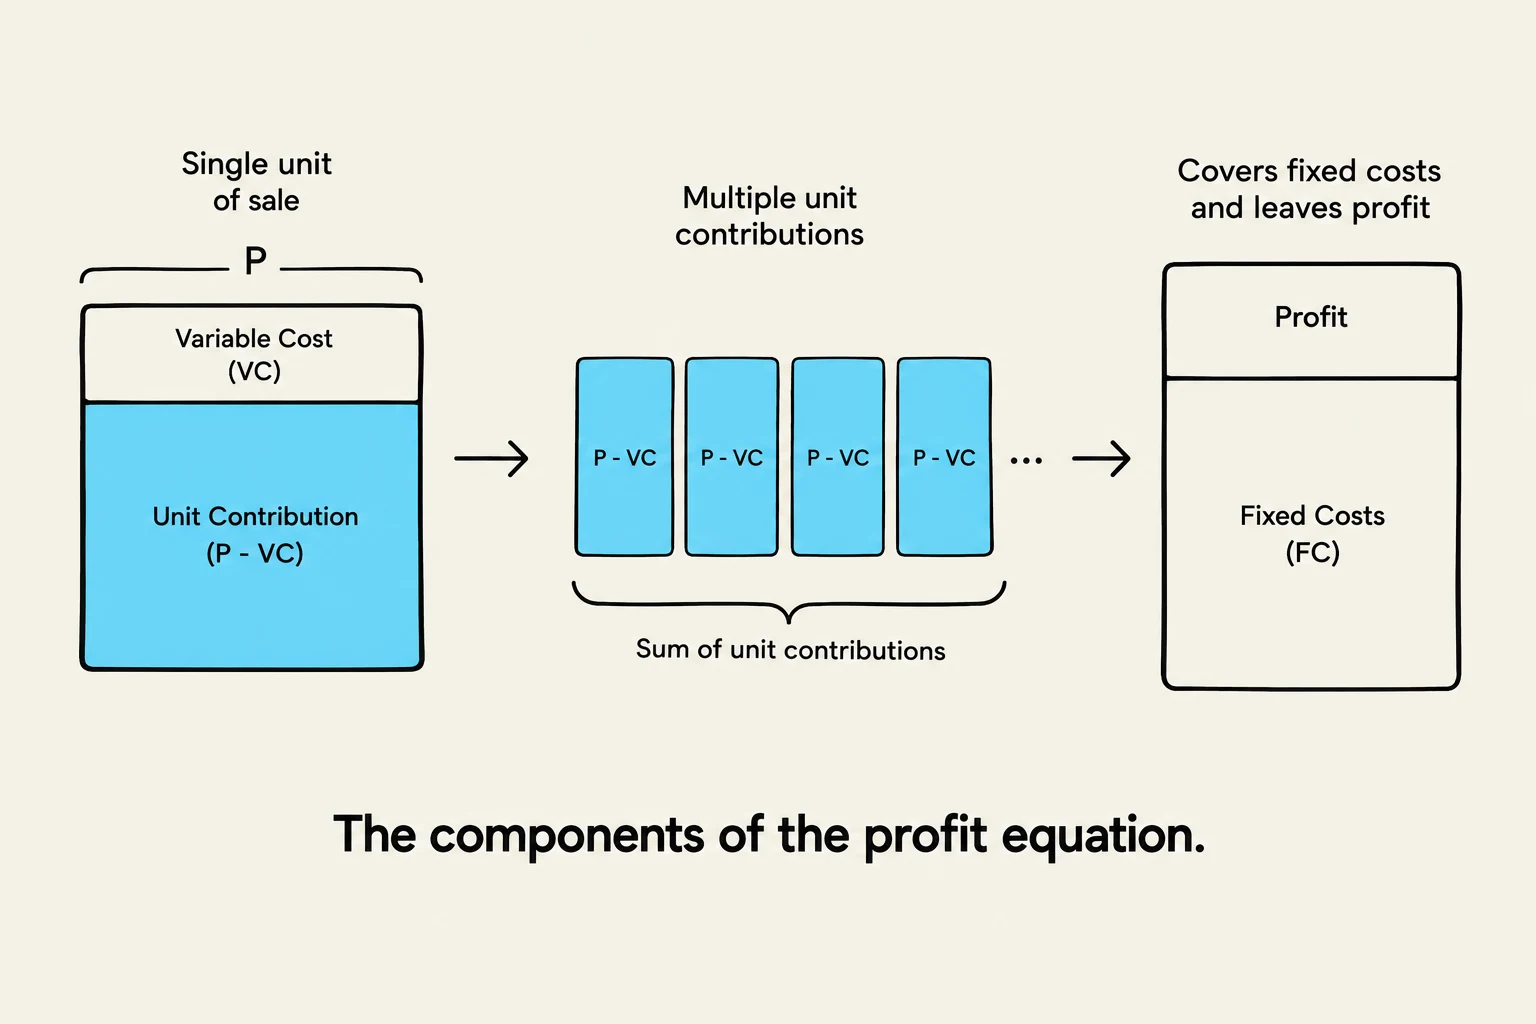
This diagram illustrates the components of the profit equation, showing how the price (P) minus variable cost (VC) per unit contributes to covering fixed costs (FC) and generating profit.
To analyze any business, we must first break down the components of the basic profit equation:
Profit=(P−VC)×Q−FC
Where:
Price (P): The amount charged to the customer per unit.
Variable Cost (VC): Costs that change with every unit sold (e.g., water, chemicals, electricity).
Volume (Q): The number of units sold.
Fixed Costs (FC): Costs that remain constant regardless of volume (e.g., rent, insurance, salaries).
Key Metrics for Analysis
When evaluating a product, managers use three specific metrics to understand how much "room" they have to play with:
Unit Contribution: This is the absolute dollar amount each sale contributes to covering fixed costs and generating profit. It is calculated as:
$P - VC$
Contribution Margin: This expresses the unit contribution as a percentage of the price. It tells you what portion of every dollar earned is "left over" after paying variable costs:
PP−VC
Markup on Variable Cost: This ratio compares the contribution to the cost of producing the unit:
VCP−VC
Exam Tip: Pay close attention to the "base" of your percentages. Margin is always calculated using Price as the denominator, while Markup is calculated using Variable Cost as the denominator.
Worked Example: Hilltop Express Car Wash
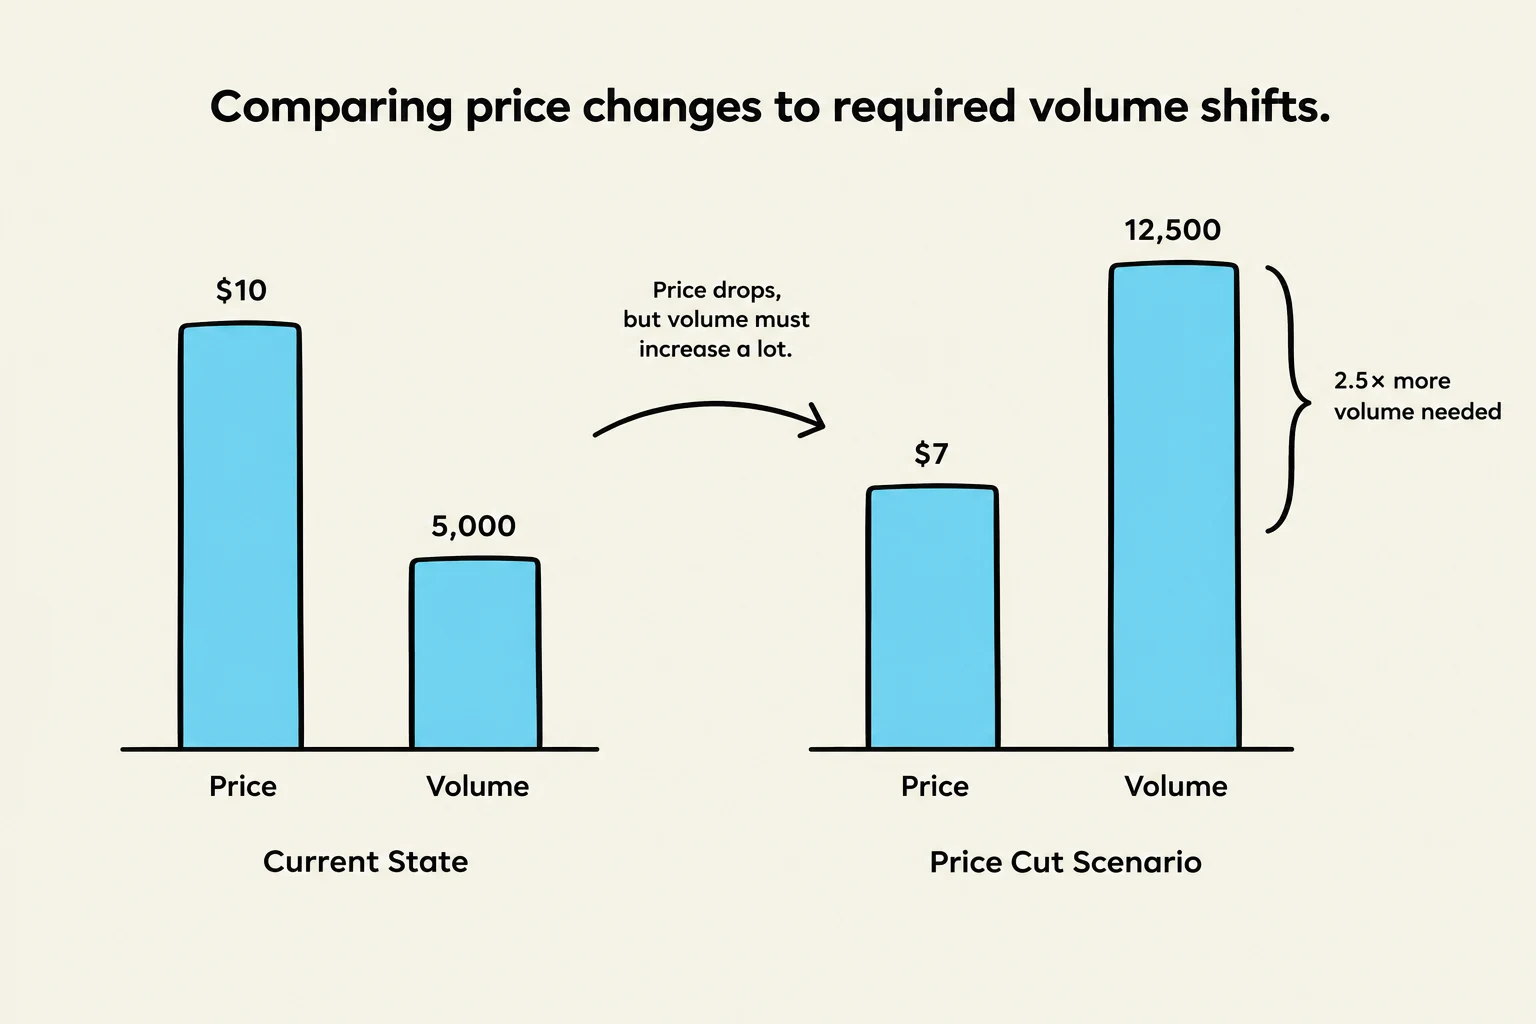
This graph illustrates how a price reduction from $10 to $7 necessitates a more than doubling of sales volume (from 5,000 to 12,500 units) to achieve the same revenue.
Let's apply these concepts to the Hilltop Express Car Wash scenario:
Price (P): $12
Variable Cost (VC): $4
Fixed Costs (FC): $$24,000$ per month
Current Volume (Q): $4,500$ washes per month
1. Current Unit Economics
Unit Contribution: $$12 - $4 = 8 per wash.
Contribution Margin:$12$8≈66.7%.
Markup on VC:$4$8=200%.
2. Break-even Analysis
The Break-even Point is the volume at which total revenue exactly equals total costs (profit is zero).
Break-even Volume:P−VCFC=$8$24,000=3,000 washes per month.
Break-even Market Share: If the total market is $20,000$ washes, Hilltop needs 20,0003,000=15% of the market to break even.
3. Current Monthly ProfitProfit=($8×4,500)−$24,000=$36,000−$24,000=$12,000 per month.
Strategic Pricing: The Price Cut vs. The Price Rise
One of the most dangerous mistakes a manager can make is assuming that a small price cut will be easily offset by a small increase in volume.
The Danger of the Price Cut
Suppose Hilltop decides to "win the neighborhood" by dropping the price to $10.
New Unit Contribution: $$10 - $4 = 6.
New Break-even Volume (to maintain $$12,000$ profit):
To find the volume needed to maintain the same profit, we use:
Q=P−VCFC+Target Profit=$6$24,000+$12,000=6,000 washes.
To stay at the same profit level, volume must rise from $4,500to6,000$. This is a $33.3%$ increase in volume required just to offset a $16.7%$ price cut. In many industries, such a massive "spike" in demand is unrealistic, making price cuts a high-risk strategy.
The Buffer of the Price Rise
Conversely, if Hilltop raises its price to $14:
New Unit Contribution: $$14 - $4 = 10.
Volume needed for same profit:$10$36,000=3,600 washes.
Hilltop can afford to lose 900 customers ($4,500 - 3,600$) and still make the same profit. This represents a $20%$ drop in volume that the business can "afford".
The Margin-Sensitivity Relationship
There is an inverse relationship between the contribution margin and the volume loss a business can afford during a price increase. As the contribution margin increases, the business becomes more sensitive to volume drops. Because each customer is more profitable, losing even a small percentage of customers results in significant profit erosion. This concept is often visualized via isoprofit curves—lines representing combinations of price and volume that yield the same profit.
Decision Making: Sunk Costs and Incremental Analysis
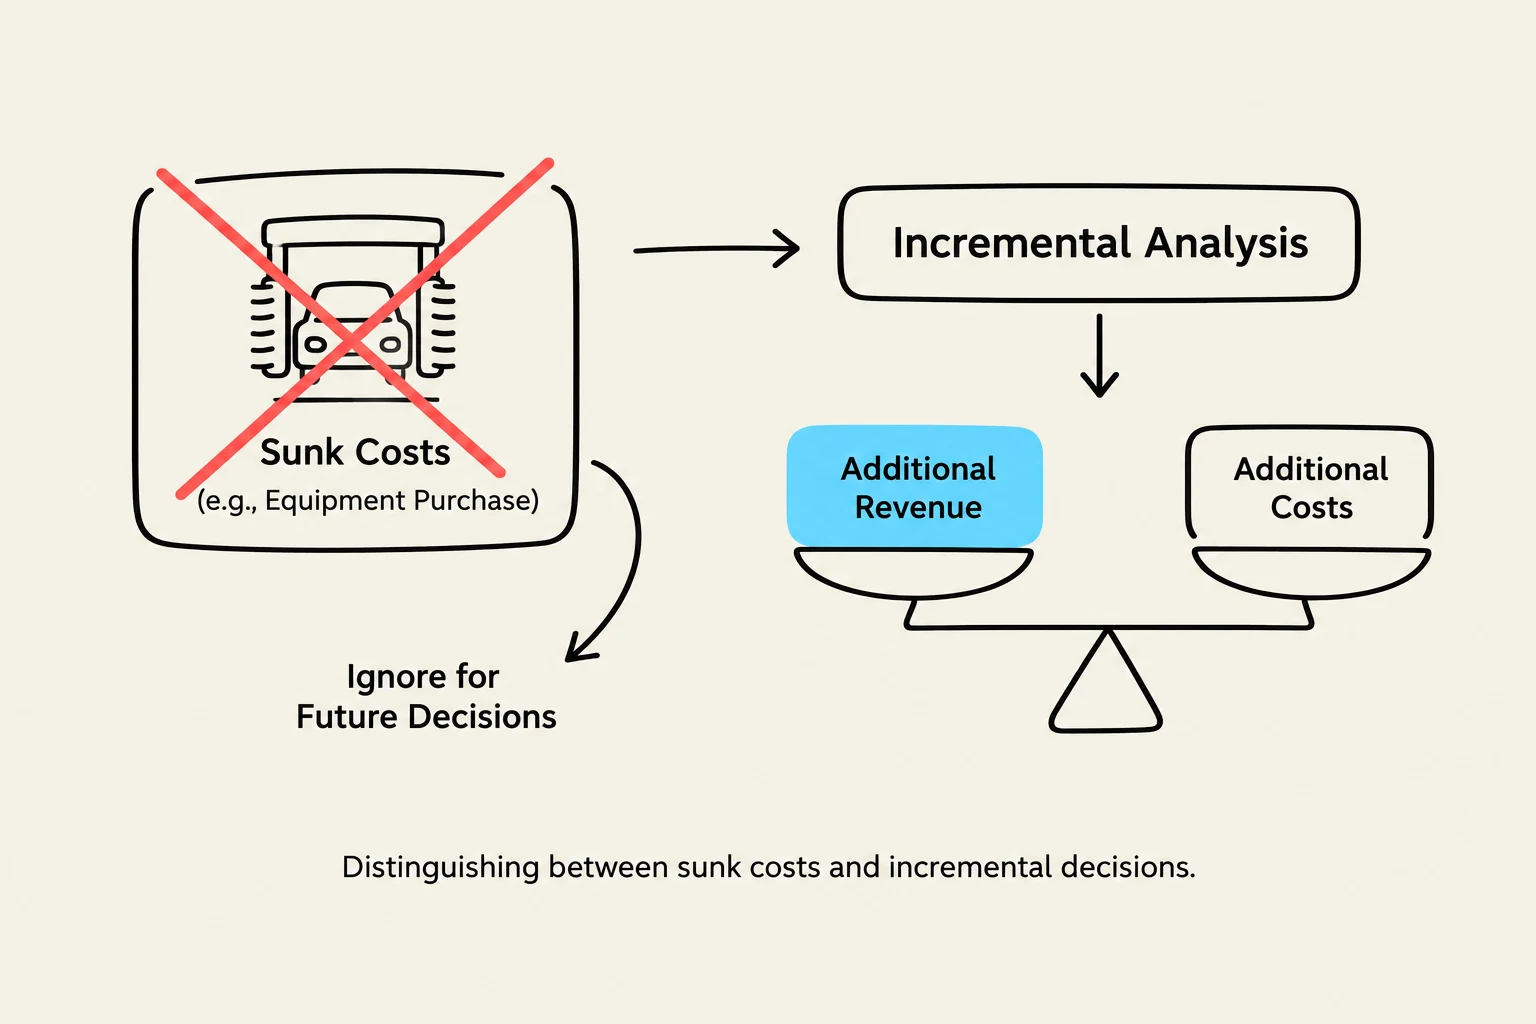
This diagram illustrates the concept of sunk costs, emphasizing that they should be ignored for future decisions. It contrasts sunk costs with incremental analysis, which considers additional revenue and additional costs.
A common psychological trap in business is the Sunk Cost Bias. An owner might argue, "We paid $$150,000$ for this tunnel equipment; our prices must be high enough to recover it".
From a financial decision-making standpoint, this is incorrect. Sunk costs are past investments that cannot be recovered and should be ignored when making future decisions.
When deciding whether to invest in new marketing (like a $$2,400$ billboard) or new equipment, you should only consider incremental values—the additional revenue and additional costs that will occur if and only if you take the action.
Decision Rule: A decision should be based on whether the future expected cash flows from an action outweigh the future costs of that action, regardless of how much has already been spent. Attempting to "recover" sunk costs by raising prices often leads to losing market share and even greater financial loss.
Keep reading for free.
Create an account to finish this reading and make it part of your study routine.