Population vs. Sample: The Foundation of Statistical Inference
This reading explains the fundamental statistical concepts of population and sample, differentiating between parameters and statistics, and highlighting the importance of representativeness and bias in data analysis.
In the world of statistics, we rarely have the luxury of knowing everything about everyone. If a scientist wants to know the average height of every adult in the United States, they cannot possibly measure over 250 million people. Instead, they rely on a fundamental distinction that allows us to make educated guesses about the world: the difference between a population and a sample. Understanding this distinction is the first step toward mastering statistical reasoning and avoiding common pitfalls in data analysis.
Defining the Population
The population is the entire group that you want to draw conclusions about. It represents the "big picture"—the complete set of all individuals, objects, or measurements that share a specific characteristic of interest.
It is important to note that a "population" in statistics does not necessarily mean "people." A population could be all the lightbulbs produced by a specific factory in a day, every star in a particular galaxy, or every transaction made on a website in a month. When we talk about the population, we are talking about the theoretical "whole" that defines the scope of our study.
When we calculate a numerical value that describes a population (such as the true average height of all humans), we call that value a parameter.
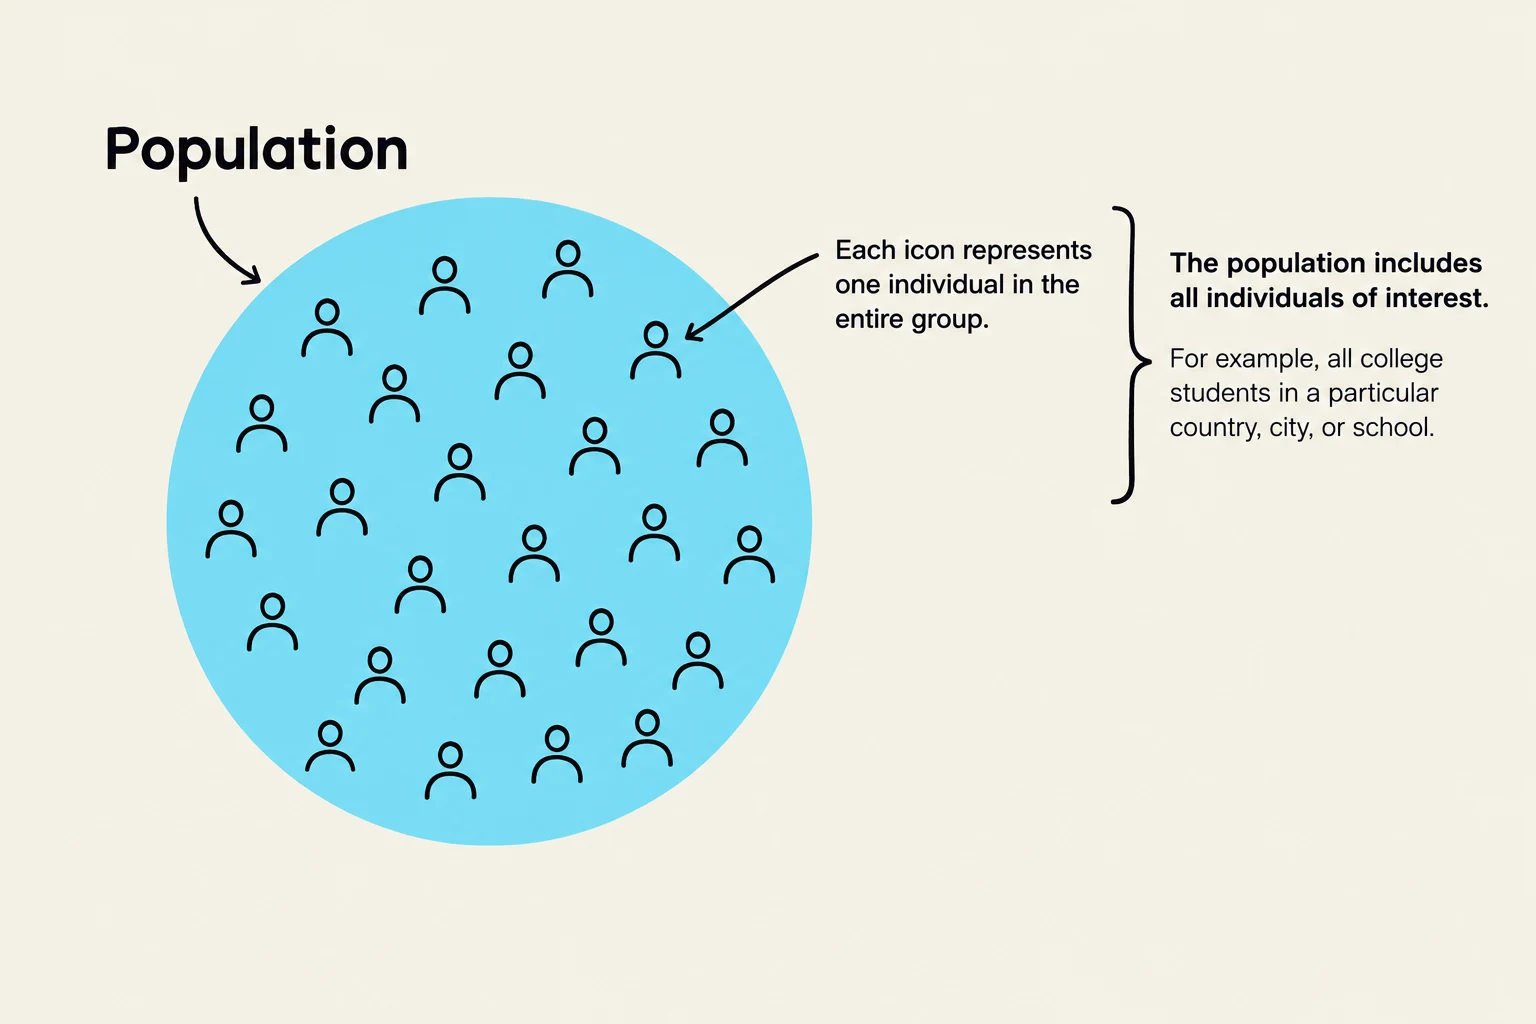
This diagram illustrates the concept of a population in statistics, where each icon represents an individual within the group of interest, such as all college students in a specific location.
Defining the Sample
Since studying an entire population is often impossible due to constraints in time, money, or logistics, researchers collect a sample. A sample is a specific, smaller group of individuals or observations selected from within the population.
The goal of sampling is to use the data collected from this subset to make inferences about the larger population. When we calculate a numerical value from a sample (such as the average height of 100 people we actually measured), we call that value a statistic.
Exam Tip: Always remember the "P-P" and "S-S" rule to keep your terminology straight:
Population →Parameter
Sample →Statistic
The Relationship: From Sample to Population
The core of statistical science is inference. We use the statistics we find in our sample to estimate the unknown parameters of the population.
For example, if we take a sample of 500 voters and find that $52%$ support a specific policy, we use that $52%$ (the sample statistic) to estimate the actual percentage of the entire country (the population parameter) that supports the policy.
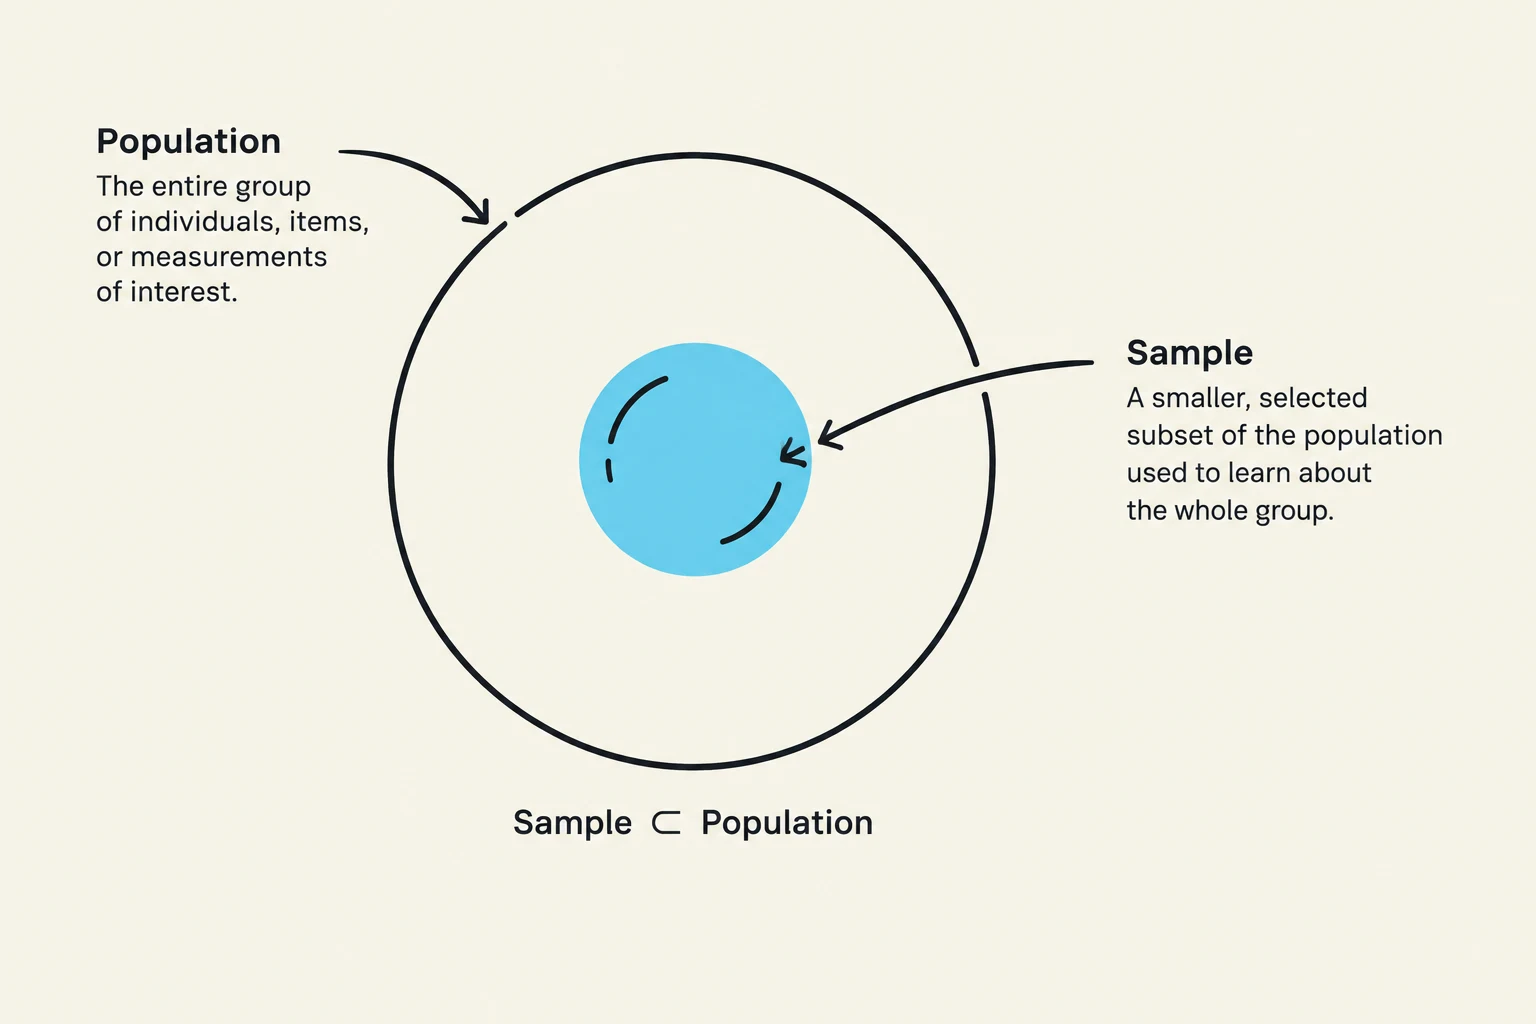
This diagram illustrates the relationship between a population and a sample, where the sample is a subset of the population used for study.
However, this relationship is not perfect. Because a sample is only a part of the whole, there will always be some level of uncertainty. This uncertainty is often expressed through a margin of error or confidence intervals.
The Importance of Representativeness and Bias
For a sample to be useful, it must be representative of the population. A representative sample is one that accurately reflects the characteristics of the entire group.
If a sample is not representative, we encounter bias. Bias occurs when certain members of the population are systematically more likely to be selected than others, leading to results that do not accurately reflect the population.
Common Types of Sampling Issues:
Selection Bias: Occurs when the method of choosing the sample excludes certain parts of the population (e.g., conducting an online-only survey excludes people without internet access).
Non-response Bias: Occurs when the individuals who choose to participate in a study differ significantly from those who do not.
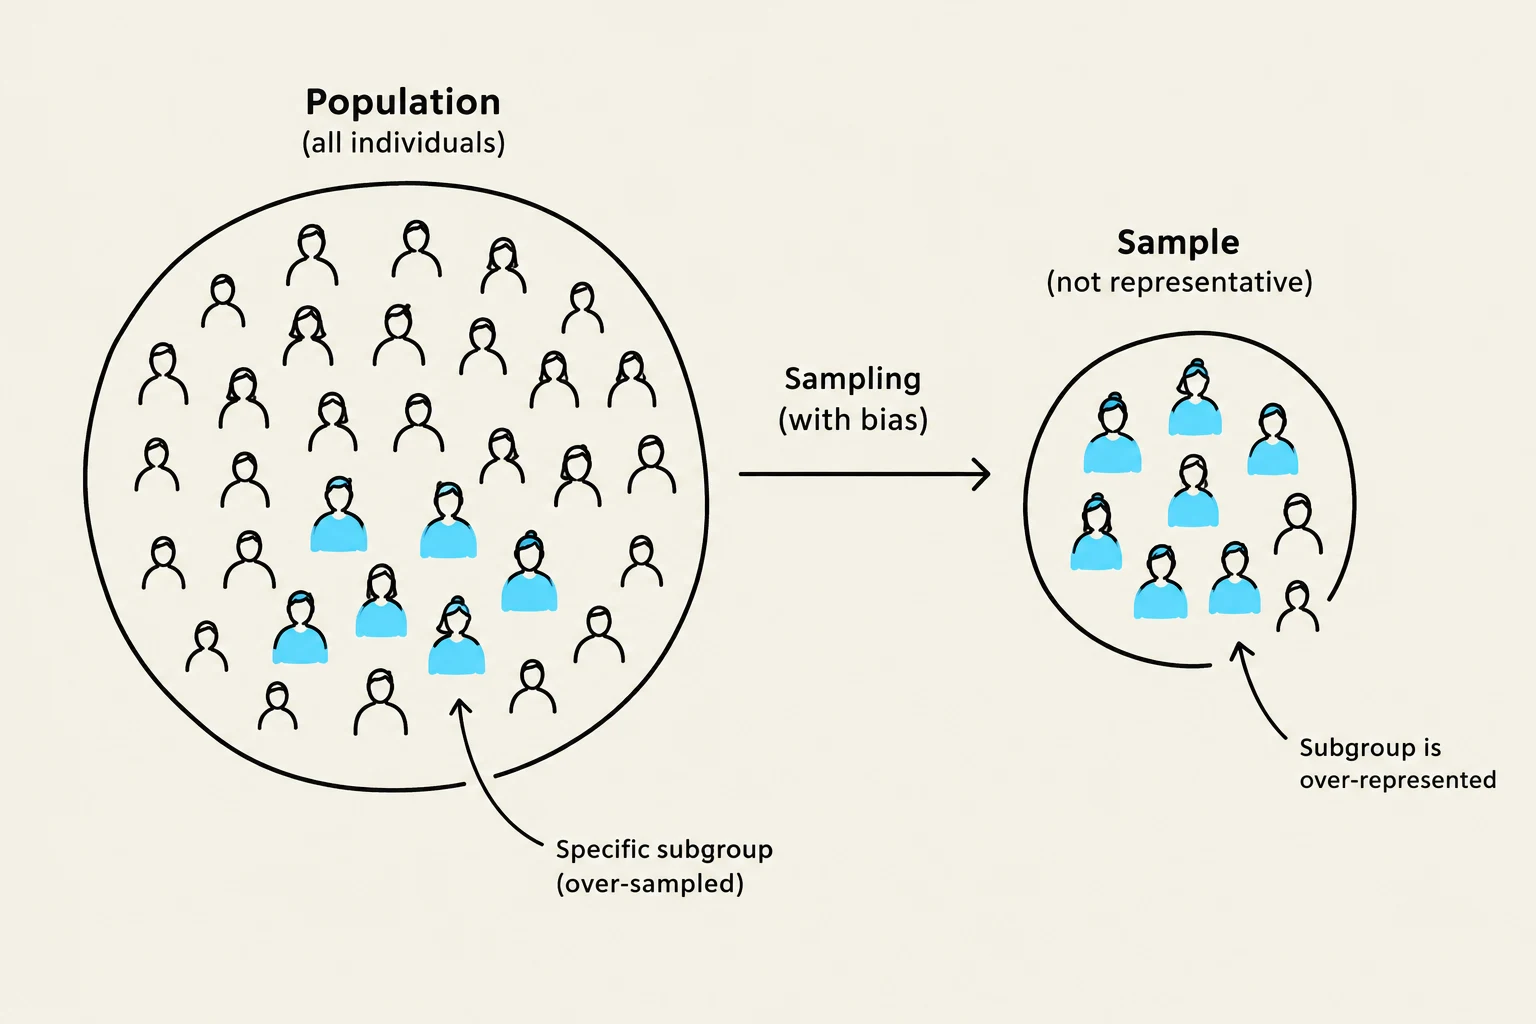
This diagram illustrates biased sampling, where a specific subgroup is over-represented in the sample, leading to a sample that is not representative of the overall population.
Worked Example: The Coffee Shop Study
To solidify these concepts, let's look at a practical scenario.
Scenario: A researcher wants to know the average amount of money spent per visit by customers at "The Daily Grind" coffee shop.
The Population: Every single customer who has ever visited or will ever visit "The Daily Grind".
The Parameter: The true average amount spent per visit by all customers (this is usually unknown).
The Sample: The researcher stands in the shop on a Tuesday and records the receipts of 50 customers.
The Statistic: The average amount spent by those 50 specific customers (e.g., $6.50).
Critical Thinking: Is this sample representative?
If the researcher only collects data on a Tuesday morning, they might only be capturing "commuter" behavior (people grabbing quick coffee on the way to work). They might miss the "afternoon relaxers" or "weekend students" who spend more time and money. This would result in a biased sample, and the resulting statistic would likely underestimate the true population parameter.
Summary Table
Feature
Population
Sample
Definition
The entire group of interest
A subset of the population
Goal
To identify the true characteristics
To estimate population characteristics
Numerical Value
Parameter
Statistic
Feasibility
Often difficult or impossible to measure
Practical and manageable to measure
Keep reading for free.
Create an account to finish this reading and make it part of your study routine.