Population Growth and Demographics: An Ecological Overview
Explore the fundamental concepts of population ecology, including exponential and logistic growth models, density-dependent and independent factors, and methods for estimating population size like mark-recapture. This guide also covers demographic tools such as survivorship curves and age-structure pyramids to understa
Understanding how populations change over time is a fundamental goal of ecology. By studying the rates at which individuals are born and die, and by identifying the factors that limit growth, biologists can predict future population sizes, manage endangered species, or understand the impact of human activity on the environment. This guide explores the mathematical models of growth, the methods used to estimate population sizes, and the demographic tools used to analyze age structures.
Population Growth and Decline
At its simplest level, population change is determined by the balance between the birth rate (the number of individuals born per unit of time) and the death rate (the number of individuals dying per unit of time). When the birth rate exceeds the death rate, the population grows; when the death rate exceeds the birth rate, the population declines.
Exponential vs. Logistic Growth
When resources are unlimited, populations can undergo exponential growth. This occurs when the per-capita growth rate remains constant regardless of population size, resulting in a "J-shaped" curve. This growth is modeled by the exponential growth equation:
Nt=N0ert
In this equation, Nt is the population size at time t, N0 is the initial population size, e is Euler's number, and r is the intrinsic rate of growth. The value of r represents how quickly a population can grow under ideal conditions.
However, in the real world, resources like food, space, and water are finite. As a population grows, these limiting factors cause the growth rate to slow down, eventually leveling off at the carrying capacity (K)—the maximum number of individuals an environment can sustainably support. This pattern is known as logistic growth, which produces an "S-shaped" curve. The logistic growth equation is expressed as:
Nt=1+(N0K−N0)e−rtK
Comparison of J-shaped (exponential) and S-shaped (logistic) population growth models, illustrating the impact of resource availability on growth rate and population size over time.
Exam Tip: If a question asks you to identify a population approaching its carrying capacity, look for a scenario where the birth rate is decreasing and the death rate is increasing as the population density rises.
Density-Dependent and Density-Independent Controls
Population growth is regulated by two distinct types of environmental factors:
Density-dependent controls: These factors have an impact that changes based on how crowded the population is. Examples include competition for food, the spread of contagious diseases, and increased predation as prey becomes easier to find.
Density-independent controls: These factors affect the population regardless of its density. Common examples include abiotic events like severe rainstorms, temperature drops (cold snaps), or the total removal of a habitat.
Estimating Population Size: The Mark-Recapture Method
Biologists often need to know the current size (N) of a population to study its growth. One common technique is the mark-recapture method, specifically the Lincoln–Petersen method.
In this method, a researcher captures a sample of individuals, marks them (e.g., with a tag or a tiny sweater), and releases them back into the wild. After a period of time, the researcher returns and captures a second sample. By comparing the number of marked individuals in the second sample to the total number captured, the researcher can estimate the total population size using the following ratio:
NM=RC
Where:
M = Number of individuals initially marked
N = Total population size (the value we want to estimate)
C = Total number of individuals captured in the second sample
R = Number of marked individuals recaptured in the second sample
Critical Thinking: The mark-recapture method relies on several assumptions, such as the population being "closed" (no births, deaths, or migrations between visits) and that marking an individual does not change its probability of being recaptured. If marked individuals are easier to spot than unmarked ones, your estimate for N will be artificially low.
Demographics and Age Structure
Demographics is the study of how different age groups within a population contribute to its overall growth and survival.
Survivorship Curves
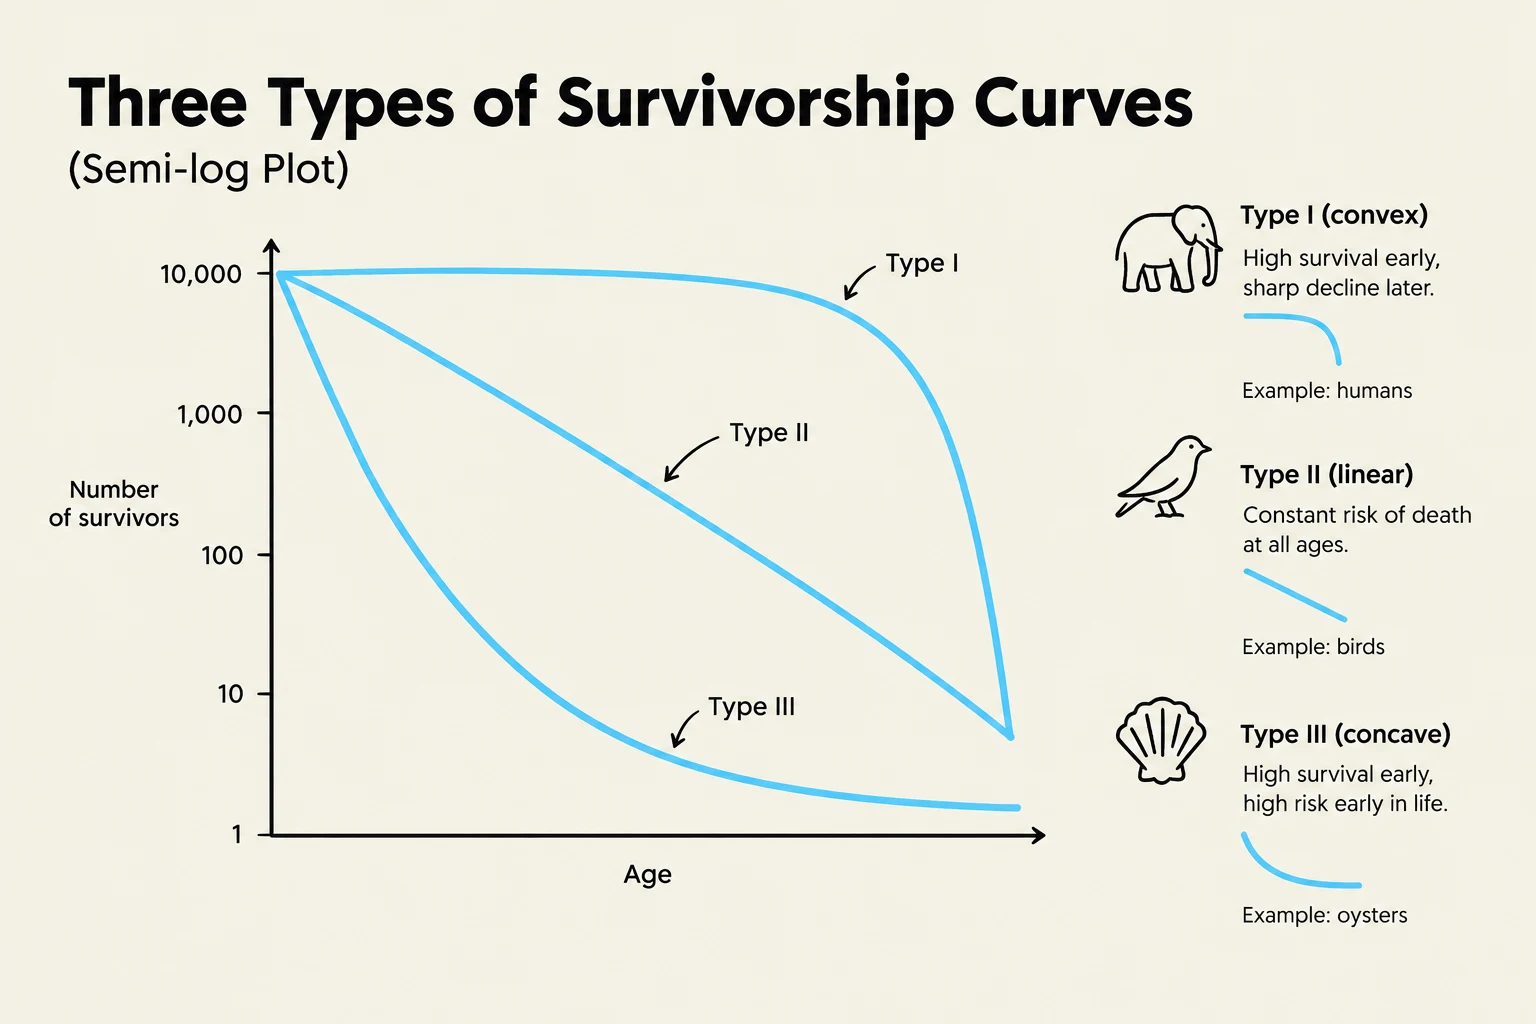
To understand mortality patterns, biologists use survivorship curves, which plot the number of survivors against age. When these are plotted on a semi-log scale (where the y-axis is logarithmic), different patterns become easy to distinguish:
Type I: High survivorship in early and middle life, with most deaths occurring in old age (e.g., humans).
Type II: A constant proportional death rate throughout the organism's life.
Type III: Very high mortality rates for the young, with high survivorship for the few individuals that reach adulthood (e.g., many fish or turtles).
This graph illustrates three types of survivorship curves: Type I (convex), Type II (linear), and Type III (concave), with examples of organisms that exhibit each type.
Life Tables and Reproductive Rates
A life table is a tool used to track age-specific survival and reproduction. From a life table, we can calculate several vital demographic quantities:
Net reproductive rate (R0): The average number of offspring an individual is expected to have over its lifetime.
Generation time (G): The average age at which an individual produces offspring.
Per-capita rate of increase (r): A measure of how quickly the population is growing, often estimated as r≈Gln(R0).
If R0>1, the population is increasing; if R0<1, it is decreasing; and if R0=1, the population is stable.
Age-Structure Pyramids
The age structure of a population—the proportion of individuals in different age classes—is a powerful predictor of future growth.
Expanding populations: These have a "pyramid" shape with a very wide base of young individuals. Even if birth rates drop immediately, these populations often experience population momentum, continuing to grow for a generation or two because there are so many young people entering their reproductive years.
Stable or Shrinking populations: These have narrower bases, indicating fewer young individuals being born relative to the older age classes.
Understanding these structures is vital for human societies to plan for future needs in healthcare, education, and retirement systems.
Keep reading for free.
Create an account to finish this reading and make it part of your study routine.