This content explains phase diagrams, which are graphical representations of the stable states of matter at different temperature and pressure combinations. It details phase transitions like sublimation and deposition, the role of intermolecular forces, and the unique properties of water, such as its density anomalies,
Understanding how matter changes from one state to another is a fundamental concept in chemistry. Whether it is an ice cube melting in a glass or carbon dioxide turning directly into gas, these transitions are governed by the relationship between temperature and pressure. By using a tool called a phase diagram, scientists can predict exactly which state of matter—solid, liquid, or gas—will be most stable under specific environmental conditions.
Understanding Phase Diagrams
A phase diagram is a graphical representation that maps out the most stable state of matter at different combinations of temperature and pressure. On these diagrams, the axes typically represent temperature (horizontal) and pressure (vertical).
The diagram is divided into distinct regions, each corresponding to a specific state of matter: solid, liquid, or gas. The lines that separate these regions are known as phase boundaries. When a substance crosses one of these lines, it undergoes a physical change, such as melting (solid to liquid) or vaporization (liquid to gas). At a standard pressure of 1 atm, these boundary lines correspond to the melting and boiling points we observe in everyday life.
This diagram illustrates the phase transitions of water based on temperature and pressure, showing the solid, liquid, and gas phases and their boundaries.
Transitions: Sublimation and Deposition
Not all substances follow the standard solid → liquid → gas progression. Depending on the pressure, a substance might skip the liquid phase entirely.
Sublimation: In substances like CO2, the solid can transition directly into a gas at atmospheric pressure without ever becoming a liquid.
Deposition: Conversely, at temperatures below the triple point (the unique temperature and pressure where all three phases coexist), increasing the pressure on a gas can cause it to transition directly into a solid.
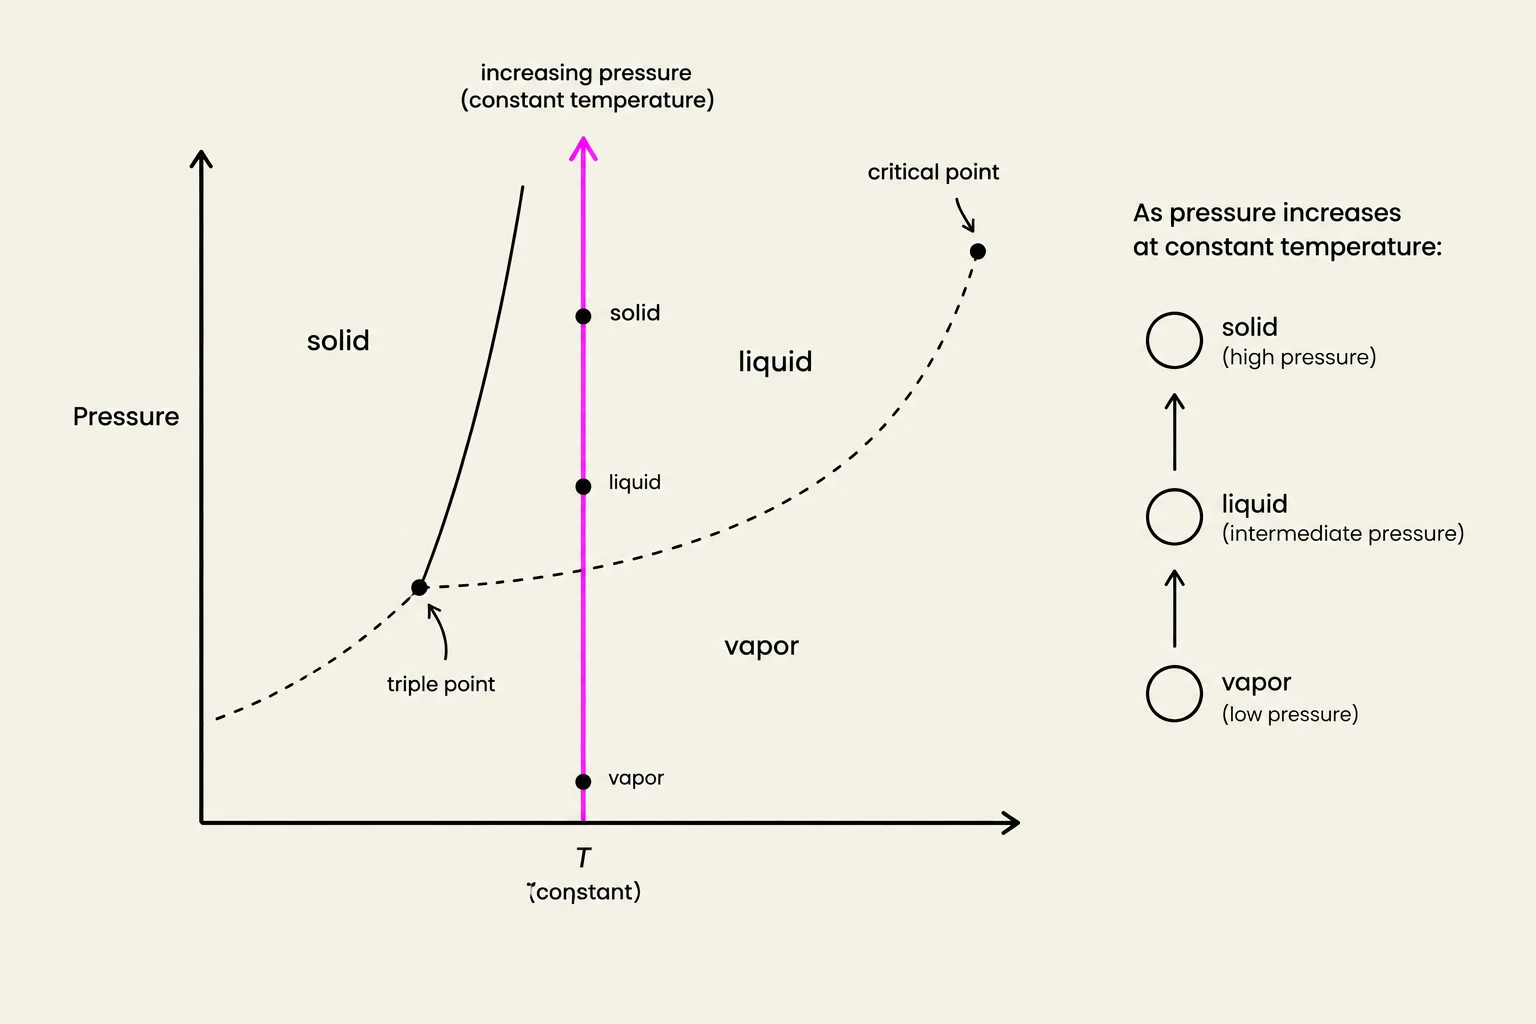
Exam Tip: When analyzing a phase diagram, remember that a change in pressure at a constant temperature is represented by a vertical line, while a change in temperature at a constant pressure is represented by a horizontal line.
The Role of Intermolecular Forces
To understand why different substances have different phase behaviors, we must look at intermolecular forces—the attractions that exist between molecules. These forces are weaker than the intramolecular forces that hold atoms together within a single molecule, but they are responsible for determining a substance's physical properties, such as boiling point and viscosity.
The strength of these attractions dictates how much energy is required to separate molecules. For example, the boiling points of noble gases increase as their atomic numbers increase because larger atoms have stronger London dispersion forces.
Hydrogen Bonding: The Powerhouse Interaction
The most significant intermolecular force discussed in this context is hydrogen bonding. A hydrogen bond occurs when a hydrogen atom, which is covalently bonded to a highly electronegative atom like Nitrogen (N), Oxygen (O), or Fluorine (F), experiences an attraction to the lone pair of electrons on a neighboring N, O, or F atom.
Hydrogen bonds are the strongest type of dipole-dipole interaction. This explains why molecules like H2O, HF, and NH3 have significantly higher boiling points than other molecules of similar mass.
Diagram illustrating hydrogen bonding between water molecules, showing the attraction between the partially positive hydrogen atoms of one molecule and the partially negative oxygen atom of another.
The Unique Properties of Water
Water is a special case in chemistry because of its extensive network of hydrogen bonds. These bonds lead to several "anomalous" properties that are essential for life on Earth.
Density Anomalies
In most substances, the solid phase is denser than the liquid phase. Water is a rare exception. As water freezes, the hydrogen bonds force the molecules into a rigid, hexagonal crystal lattice structure. This structure actually pushes the molecules further apart than they were in the liquid state, making ice less dense than liquid water.
On a phase diagram, this unique property causes the freezing point line to bend to the left, rather than the typical upward slope seen in other substances. This density difference is vital for aquatic life; because ice floats, it forms an insulating layer on the surface of lakes and rivers, allowing fish to survive in the denser liquid water below.
Surface Tension and Capillary Action
Water molecules at the surface are pulled inward by the hydrogen bonds of the molecules beside and below them, creating a "skin" that resists external force. This is known as surface tension.
This cohesive force, combined with adhesion (the attraction between water and other surfaces, like glass), allows for capillary action. Capillary action is the ability of water to flow against gravity, moving up narrow tubes or through the vessels of plants.
Thermal Properties
Because it takes a significant amount of energy to break the strong hydrogen bonds between water molecules, water possesses an unusually high boiling point relative to its molecular mass.
Worked Example: Interpreting a Phase Change
Problem: Describe the phase changes that take place when the pressure on a sample of water is increased from 0.0001 atm to 100 atm at a constant temperature of −25∘C, and the sample is then warmed from −25∘C to 350∘C at a constant pressure of 100 atm.
Step 1: Analyze the Pressure Increase (Vertical Line)
At −25∘C, the starting pressure is 0.0001 atm. At this low pressure and temperature, water is in the gas (vapor) phase. As we increase the pressure vertically, we cross the boundary between gas and solid. Therefore, the vapor undergoes deposition to become solid ice.
Step 2: Analyze the Temperature Increase (Horizontal Line)
Now, at a constant pressure of 100 atm, we increase the temperature from −25∘C toward 350∘C.
As the temperature rises, the ice reaches its melting point and undergoes melting to become liquid water.
As heating continues, the liquid reaches its boiling point and undergoes vaporization to become gas.
Summary of Transitions:GasdepositionSolidmeltingLiquidvaporizationGas
A phase diagram illustrating the states of matter (solid, liquid, vapor) as a function of temperature and pressure, including the triple point and critical point. It also shows the effect of increasing pressure at constant temperature on the state of a substance.
Keep reading for free.
Create an account to finish this reading and make it part of your study routine.