Parameters vs. Statistics: Understanding Populations and Samples
This reading explains the fundamental statistical concepts of parameters and statistics, differentiating between characteristics of a population and a sample. It covers common notation, provides a worked example, and discusses estimation and sampling error.
In the world of data science and research, we are often trying to answer a fundamental question: "What is true about the world?" However, we rarely have the luxury of looking at every single person, object, or event in existence. Instead, we look at a small piece of the puzzle to guess what the whole picture looks like. To do this accurately, statisticians rely on a crucial distinction between two concepts: parameters and statistics.
Understanding this distinction is the foundation of inferential statistics—the process of using data we have to make educated guesses about data we don't have.
The Population and the Parameter
Before we can define a parameter, we must define the population. In statistics, a population is the entire group that you want to draw conclusions about. This could be every adult living in the United States, every star in the Milky Way, or every lightbulb produced by a specific factory in a single day.
A parameter is a numerical value that describes a characteristic of that entire population. Because a parameter represents the "true" value of the whole group, it is often considered a fixed value. However, in most real-world scenarios, the parameter is unknown because it is physically or financially impossible to measure every single member of a population.
For example, if you wanted to know the average height of every human being on Earth, that single, true average would be the population parameter.
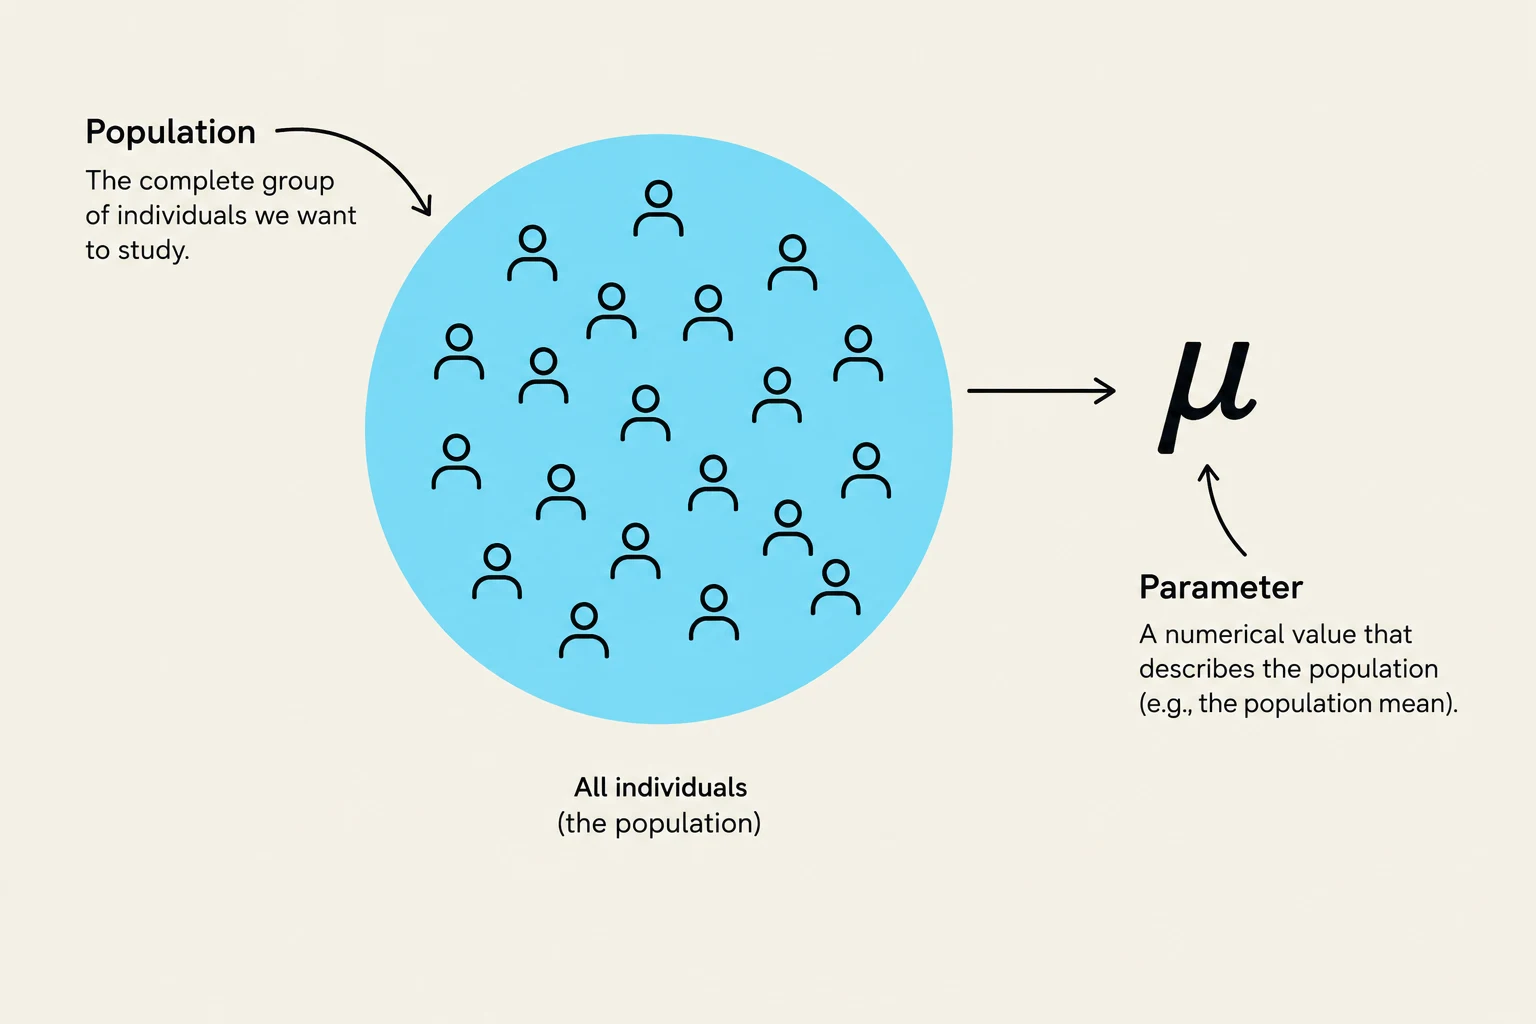
This diagram illustrates the concept of a population in statistics, defined as the complete group of individuals to be studied. It also shows a parameter, represented by the Greek letter mu (μ), which is a numerical value that describes the population, such as the population mean.
Exam Tip: If a question uses words like "all," "every," or "entire," it is likely referring to a population and its corresponding parameter.
Common Notation
Statisticians use specific Greek letters to denote population parameters to distinguish them from sample values. Common examples include:
μ (mu): The population mean.
σ (sigma): The population standard deviation.
P or π (pi): The population proportion.
The Sample and the Statistic
Since we cannot usually measure the entire population, we collect a sample. A sample is a specific group of individuals that you collect data from; it is a subset of the population.
A statistic is a numerical value that describes a characteristic of that sample. Unlike a parameter, a statistic is a "variable" value. If you take one sample of 100 people and calculate their average height, you get one statistic. If you take a different sample of 100 people, you will get a slightly different statistic.
The goal of most statistical research is to use the sample statistic to estimate the unknown population parameter.
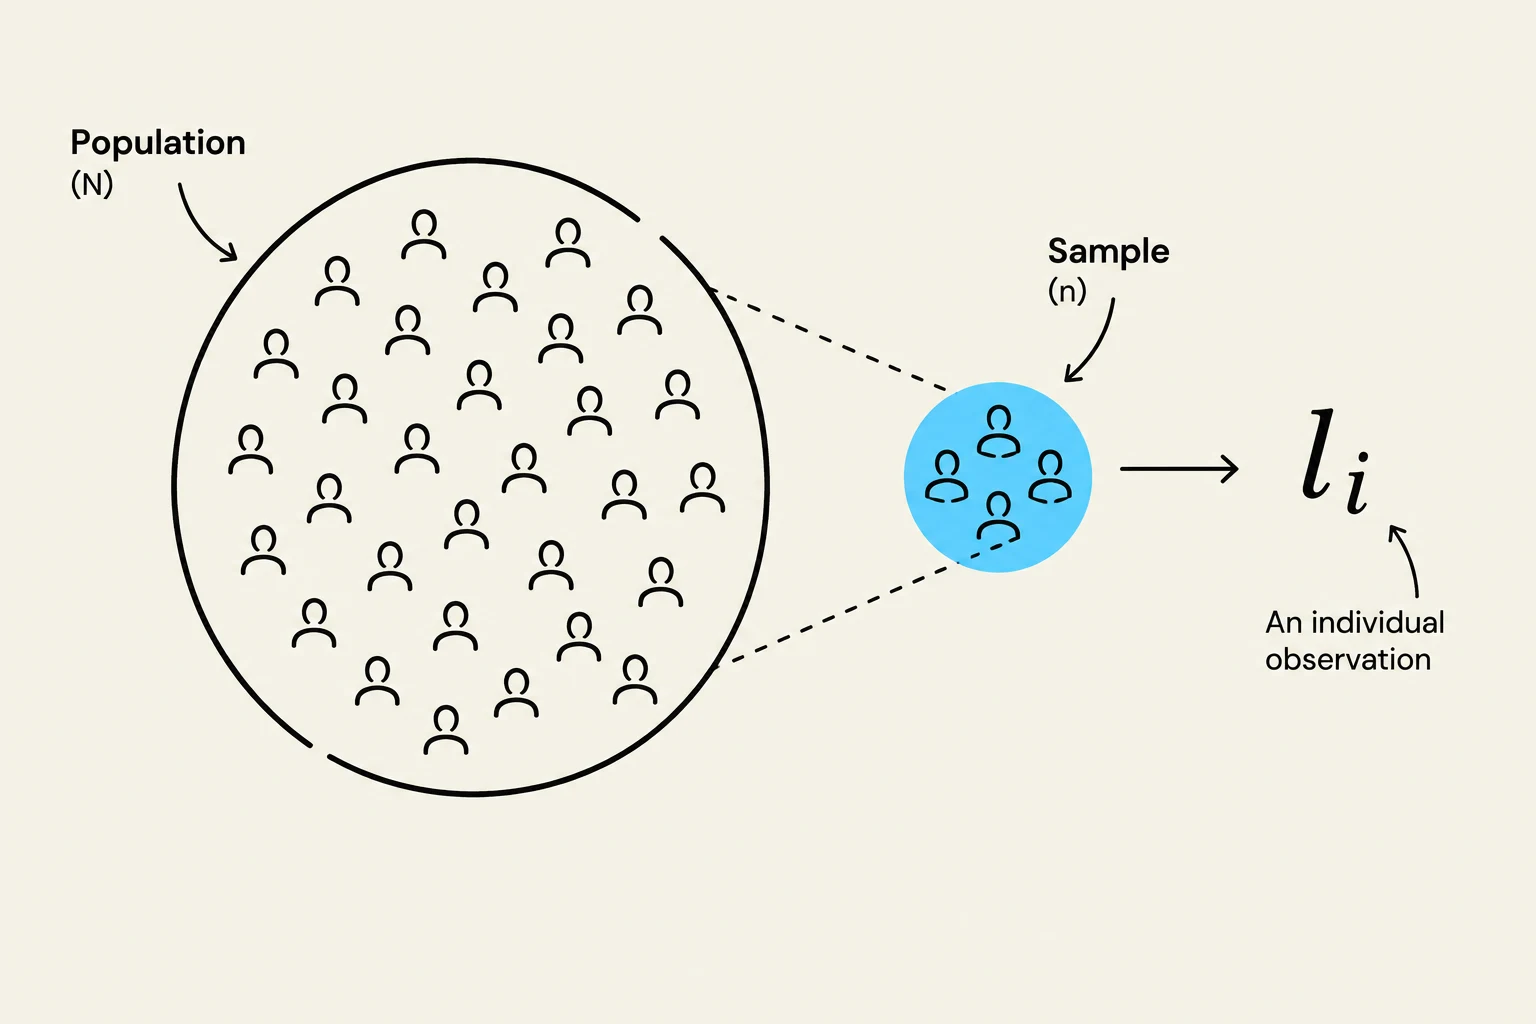
This diagram illustrates the concept of sampling in statistics, showing a large population (N) from which a smaller sample (n) is drawn for observation.
Common Notation
To distinguish these from parameters, statisticians use Latin letters for sample statistics:
xˉ (x-bar): The sample mean.
s: The sample standard deviation.
p^ (p-hat): The sample proportion.
A Worked Example: The Coffee Shop Study
To solidify these concepts, let's look at a practical scenario. Imagine you want to know the average amount of money spent by customers at a local coffee shop.
The Population: Every single customer who has ever visited or will ever visit that coffee shop.
The Parameter (μ): The true average amount spent per customer across the entire history of the shop. This value is unknown to you.
The Sample: You decide to track the receipts of 50 customers who visit the shop this Tuesday.
The Statistic (xˉ): You calculate the average of those 50 receipts and find it is $6.50.
In this case, $6.50 is your statistic. You would then use this $6.50 to make an inference about the parameter (the true average of all customers).
The Relationship: Estimation and Error
The relationship between a statistic and a parameter is the heart of statistical inference. We use the statistic as our "best guess" for the parameter. However, because a sample is only a small part of the whole, our guess will rarely be perfect.
The difference between the sample statistic and the true population parameter is known as sampling error.
Sampling Error=Statistic−Parameter
Even if your sampling method is perfect and unbiased, you will almost always see some variation between xˉ and μ simply because of the randomness of which individuals ended up in your sample.
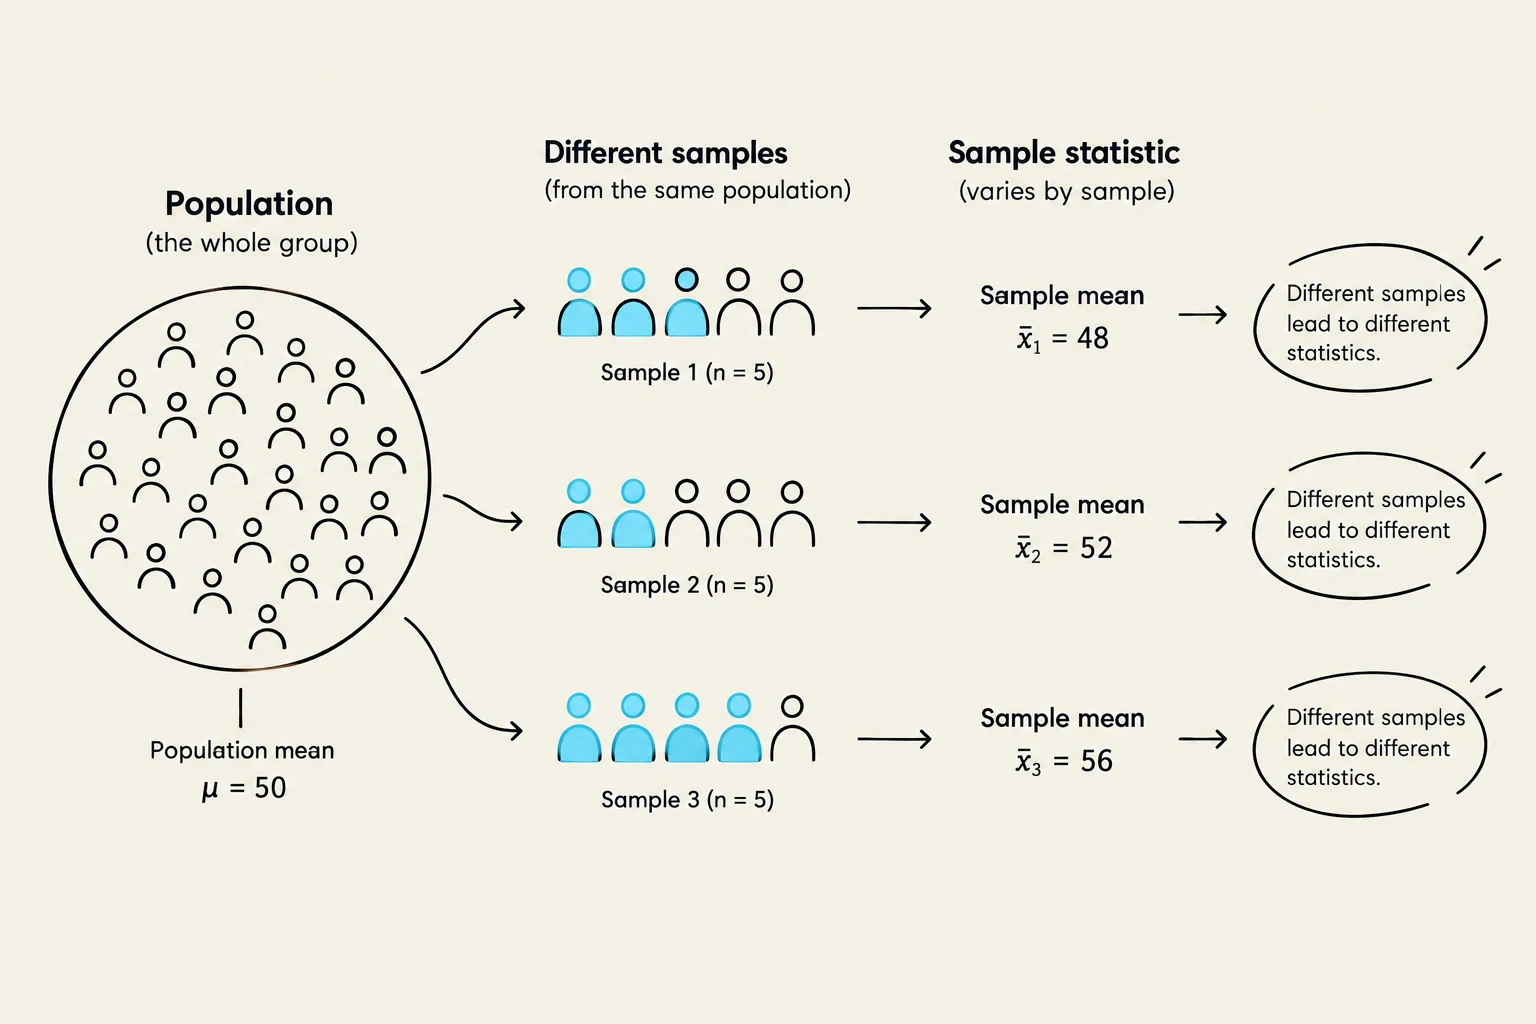
This diagram illustrates the concept of sampling in statistics, showing how different samples drawn from the same population can yield different sample means, leading to different statistics.
Summary Table
To help you study, remember this quick reference guide:
Feature
Population
Sample
Definition
The entire group of interest
A subset of the population
Descriptive Term
Parameter
Statistic
Symbols (Mean)
μ
xˉ
Symbols (Std Dev)
σ
s
Symbols (Proportion)
P or π
p^
Availability
Usually unknown/theoretical
Calculated from observed data
By mastering this distinction, you move from simply "looking at numbers" to understanding the fundamental logic of how science uses small amounts of data to understand the vast complexity of the world.
Keep reading for free.
Create an account to finish this reading and make it part of your study routine.