Parameters, Statistics, and Data Types in Statistics
An introduction to fundamental statistical concepts, including populations, samples, variables, and different types of data such as qualitative and quantitative. It also covers scales of measurement and basic measures of location like the mean, median, and mode.
In the field of statistics, our primary goal is to understand the world by making inferences about large groups based on smaller sets of information. To do this effectively, we must first master the language of data. This involves distinguishing between the groups we study, the types of information we collect, and the mathematical tools we use to summarize that information.
Populations, Samples, and Variables
The foundation of any statistical study lies in the distinction between the group we want to know about and the group we actually measure.
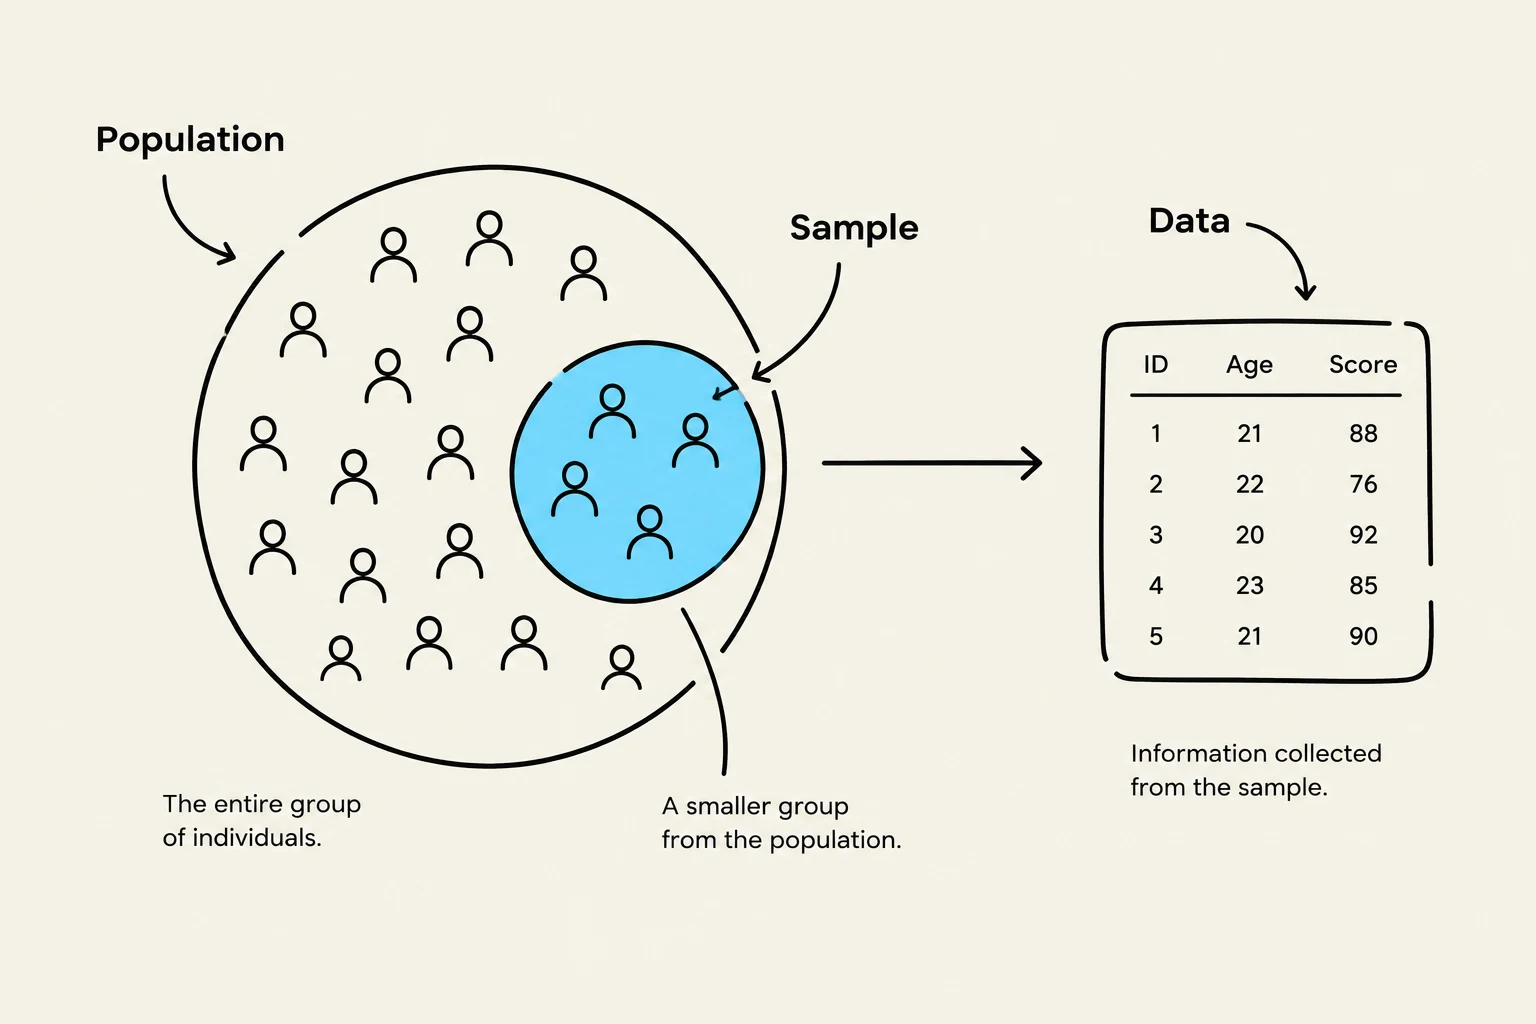
A population represents the entire set of things we wish to measure. Because it is often impossible or too expensive to measure every single member of a population, we instead select a sample, which is a subset of the population that we actually measure.
When we move from groups to specific measurements, we encounter two key terms:
Variable: A characteristic that changes from person to person or subject to subject within a study. In mathematical notation, variables are typically denoted by upper-case Roman letters, such as X or Y.
Observation: A specific, single measured value of a variable. These are denoted by lower-case Roman letters, such as x or y.
The distinction between the group and the measurement is reflected in our terminology for results: a parameter is a characteristic of a population, whereas a statistic is a characteristic of a sample.
This diagram illustrates the concept of sampling in statistics, showing how a sample is drawn from a larger population and the data collected from that sample.
Categorizing Data: Qualitative vs. Quantitative
Not all data are created equal. Depending on whether we are measuring a "label" or a "quantity," we categorize data into two primary types:
Qualitative Data
Qualitative data consist of non-numeric or coded values that represent elements of a finite set of features or behaviors.
Categorical data: Values that represent groups, such as a country of origin (e.g., USA, Canada).
Binary data: A specific type of categorical data where there are only two possible outcomes, such as employment status (yes/no).
Quantitative Data
Quantitative data consist of numeric values of measurable features.
Discrete data: Countable values, usually integers, such as the number of children in a household.
Continuous data: Measurable quantities that can take any value within a range, such as height, weight, or financial profit.
The Four Scales of Measurement
To choose the correct statistical test, we must understand the "depth" of our data. We use four scales of measurement to refine our understanding of data types:
Nominal: The simplest level. This involves categorical data with no natural ordering or ranking, such as "named" groups.
Ordinal: Data that has a natural ranking or ordering relationship, such as survey responses (e.g., "satisfied," "neutral," "unsatisfied").
Interval: Data that has a notion of distance between values, where the units of measurement are equal.
Ratio: The most informative scale. This data has a notion of magnitude where ratios are meaningful (e.g., "twice as large"). Importantly, ratio data must be non-negative.
Measures of Location
Once we have collected quantitative data, we use summary statistics to describe it. One of the most important categories is measures of location, which tell us where the "center" of the data lies.
The Sample Mean (xˉ)
The sample mean is the sum of all observations divided by the total number of observations. It is calculated using the following formula:
xˉ=n1∑i=1nxi
While the mean is the most commonly used measure, it is highly sensitive to outliers (extreme values). For example, if a dataset of weights includes one extremely low value, the mean will be pulled downward, potentially misrepresenting the "typical" subject.
The Sample Median
The median is the literal middle value of an ordered dataset. To find it, you must first order the observations from smallest to largest:
If n (the number of observations) is odd, the median is the 2n+1th observation.
If n is even, the median is the average of the 2nth and 2n+1th observations.
The Mode
The mode is the most frequently occurring value in a sample. Unlike the mean or median, a distribution can have more than one mode:
Unimodal: One mode.
Bimodal: Two modes.
Trimodal: Three modes.
This illustration compares unimodal and bimodal distributions, showing how they differ in the number of peaks.
Exam Tip: When a distribution is skewed, the mean and median will pull apart. If the data is positively skewed (tail to the right), the mean is typically greater than the median. If it is negatively skewed (tail to the left), the mean is typically less than the median.
Understanding Distribution Shape
The relationship between the mean, median, and mode allows us to describe the "shape" of a unimodal distribution:
Symmetric: The relative position of points on both sides of the median is the same. In a perfectly symmetric unimodal distribution, the mean, median, and mode are all equal.
Positively Skewed: The distribution has a long tail stretching toward higher values (to the right).
Negatively Skewed: The distribution has a long tail stretching toward lower values (to the left).
Summary Table: Choosing Measures
Shape of Data
Preferred Location Measure
Preferred Spread Measure
Unimodal, Symmetric
Mean
Standard Deviation
Unimodal, Skewed
Median
Interquartile Range (IQR)
Multimodal
N/A
N/A
Note: For multimodal data, single measures of location can be misleading.
Keep reading for free.
Create an account to finish this reading and make it part of your study routine.