In biological research, quantifying the number of cells in a sample and determining their health is a fundamental task. Whether working with yeast cultures or mammalian cell lines, scientists must be able to accurately measure cell density and viability. This article explores the essential procedures for achieving high-quality visualization through Köhler Illumination, the use of Trypan Blue to distinguish living from dead cells, and the mathematical rigor required to calculate concentrations using a haemocytometer.
Optimizing Visualization: Köhler Illumination
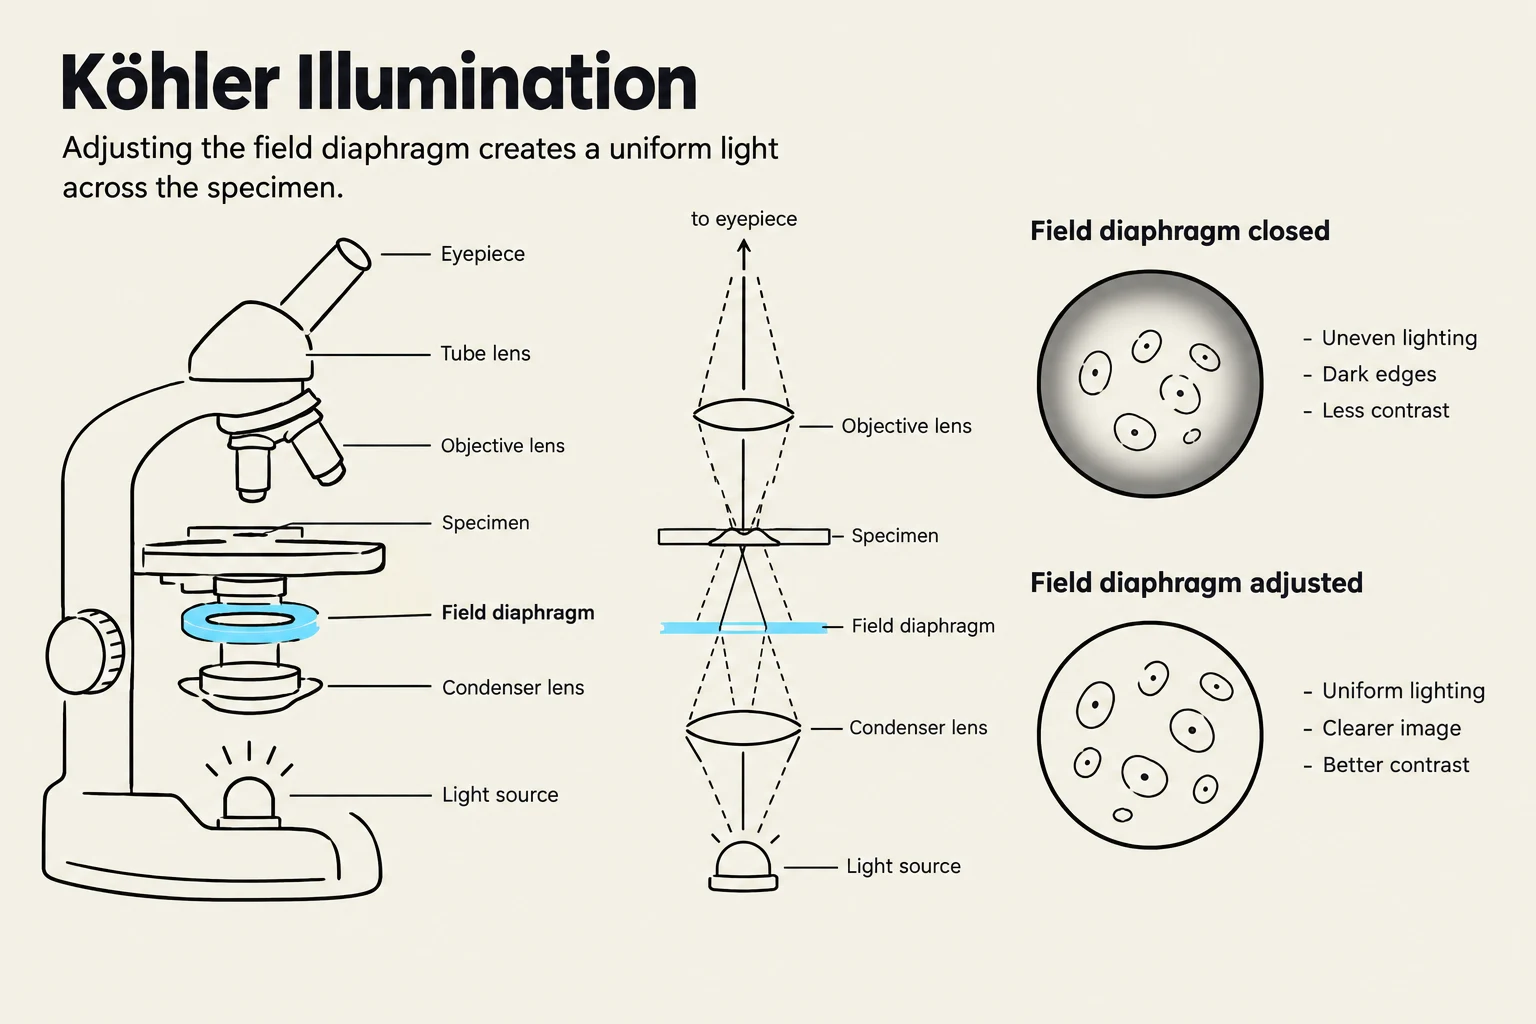
Before counting cells, one must ensure that the microscope is providing the clearest possible image. A critical step in this process is Köhler Illumination. This is a specialized procedure used to provide even illumination across the entire field of view.
By properly adjusting the field diaphragm while viewing the sample under different objectives or eyepieces, you can reduce optical artifacts and ensure that the light is focused precisely on the plane of the specimen. While this process is often performed by instructors in a laboratory setting, understanding its purpose is vital for recognizing why a clear, uniform background is necessary for accurate cell counting.
This diagram illustrates Köhler illumination, a technique used in microscopy to achieve uniform lighting across a specimen by adjusting the field diaphragm. It shows the components of a microscope and compares the visual results of a closed versus an adjusted field diaphragm, highlighting improved lighting and contrast when adjusted.
Assessing Cell Viability with Trypan Blue
Once the microscope is optimized, the next step is to differentiate between healthy and dying cells. This is commonly achieved using Trypan Blue staining.
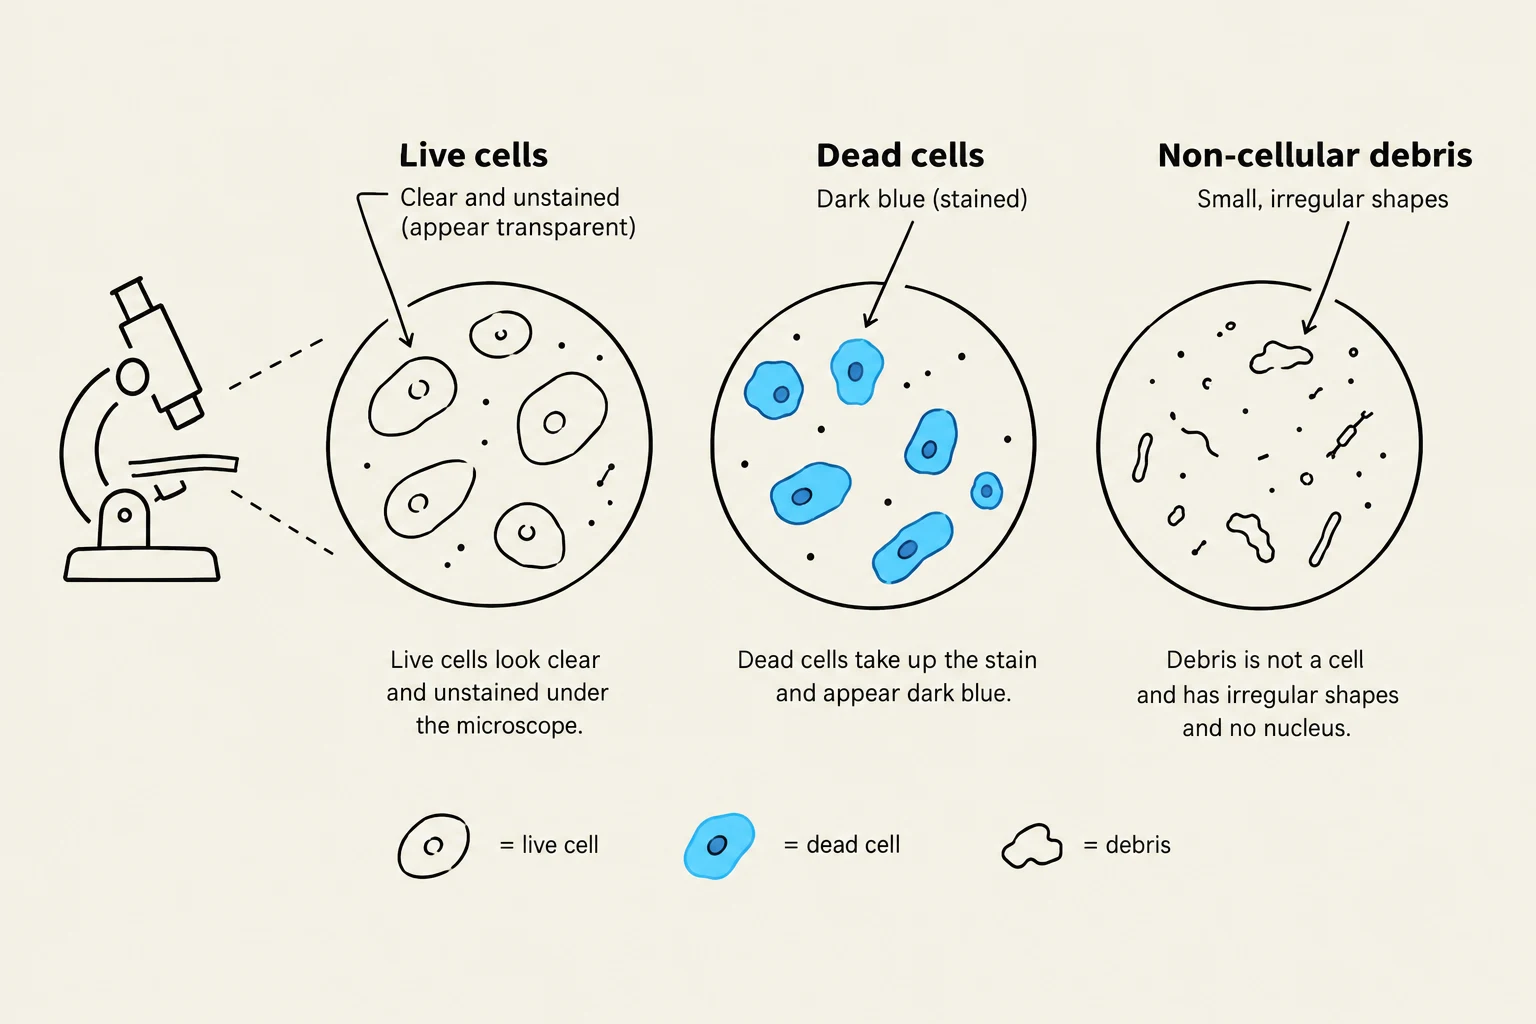
Trypan Blue is a "dye exclusion" method. In a healthy cell, the plasma membrane is intact and functions as a barrier, preventing the dye from entering the cytoplasm. However, when a cell dies, its membrane becomes permeable. The Trypan Blue then enters the cell, staining the interior a distinct blue color.
When observing your sample (such as a yeast culture), you will see two distinct populations:
Live Cells: Clear or colorless cells that have excluded the dye.
Dead Cells: Cells that appear blue.
Note on Artifacts: When looking through the lens, be careful not to confuse dead cells with debris (like lint or fibers that may stain blue) or artifacts (like dust on the lens that does not move when the sample stage is shifted).
This illustration differentiates between live cells, dead cells, and non-cellular debris as observed under a microscope. Live cells appear clear and unstained, while dead cells take up a dark blue stain. Non-cellular debris consists of small, irregular shapes that lack a nucleus.
The Haemocytometer: Loading and Counting
To quantify these cells, we use a specialized counting chamber known as a haemocytometer. This device features a laser-etched grid of squares that allows us to calculate the number of cells in a known volume.
Loading the Chamber
After mixing your sample with Trypan Blue (typically in a 1:1 ratio), the chamber is loaded with the liquid.
The Rules of Counting
Counting cells requires strict adherence to "boundary rules" to avoid overcounting or undercounting. Because cells can sit on the lines of the grid, we use a standardized convention:
Do NOT count cells that touch the top or left boundaries.
DO count cells that touch the bottom or right boundaries.
DO count all cells located in the middle of the squares.
For a complete and accurate count, you should record the number of cells in all 5 squares of both the top and bottom chambers, resulting in 10 total data points.
Mathematical Calculations
Calculating the final concentration and viability requires accounting for the volume of the chamber and the dilution of the sample.
Calculating Cell Concentration (Cells/mL)
The volume of a haemocytometer chamber is 0.004 mm3. Because 1 mm3 is equivalent to 1\muL, and there are 1,000\muL in a milliliter, the conversion factor is 250 (since 1/0.004=250).
Furthermore, because we mix the cells with Trypan Blue, we must account for the dilution factor. If you mix equal parts cell culture and dye, you have a 1 in 2 dilution, meaning you must multiply your result by 2 to find the original concentration.
The Calculation Steps:
Average the number of cells from the 10 squares.
Multiply by 250.
Multiply by the dilution factor (e.g., 2 for a 1:1 mix with dye).
Worked Example:
If the average number of live cells in the 10 squares is 42:
\text{Average} &= 42 \\
42 \cdot 250 &= 10,500 \\
10,500 \cdot 2 &= 21,000 \text{ cells/mL} \\
\text{Final Result} &= 2.1 \times 10^4 \text{ cells/mL}
\end{aligned}$$
### Calculating Cell Viability
Viability is the percentage of the total population that is alive. To find this, you must perform the same concentration calculation for the dead (blue) cells as you did for the live cells.
The formula for viability is:
$$\text{Cell Viability} = 1 - \left( \frac{\text{Total Dead Cells}}{\text{Total Live Cells}} \right)$$
*Or, expressed as a percentage:*
$$\text{Viability \%} = \left( 1 - \frac{\text{Dead Cells}}{\text{Live Cells} + \text{Dead Cells}} \right) \cdot 100$$
**Worked Example:**
If you have calculated $2.1 \times 10^4$ live cells/mL and $500$ dead cells/mL:
$$\begin{aligned}
\text{Viability} &= 1 - \frac{500}{2.1 \times 10^4} \\
\text{Viability} &= 1 - 0.02 \\
\text{Viability} &= 0.98 \text{ (or 98\%)}
\end{aligned}$$
> **Exam Tip:** Always remember to apply the **dilution factor** to both your live and dead cell counts before calculating the final viability percentage, or ensure you are comparing "apples to apples" by using the same units for both.
$$$
$$$
Keep reading for free.
Create an account to finish this reading and make it part of your study routine.