


In microeconomics, the study of consumer behavior revolves around a fundamental tension: what a consumer wants to do versus what a consumer can do. This tension is defined by the interplay between preferences (utility) and limitations (the budget constraint). By understanding these two forces, we can model how individuals make choices to maximize their satisfaction within their financial means.
Tastes, Preferences, and Utility Curves
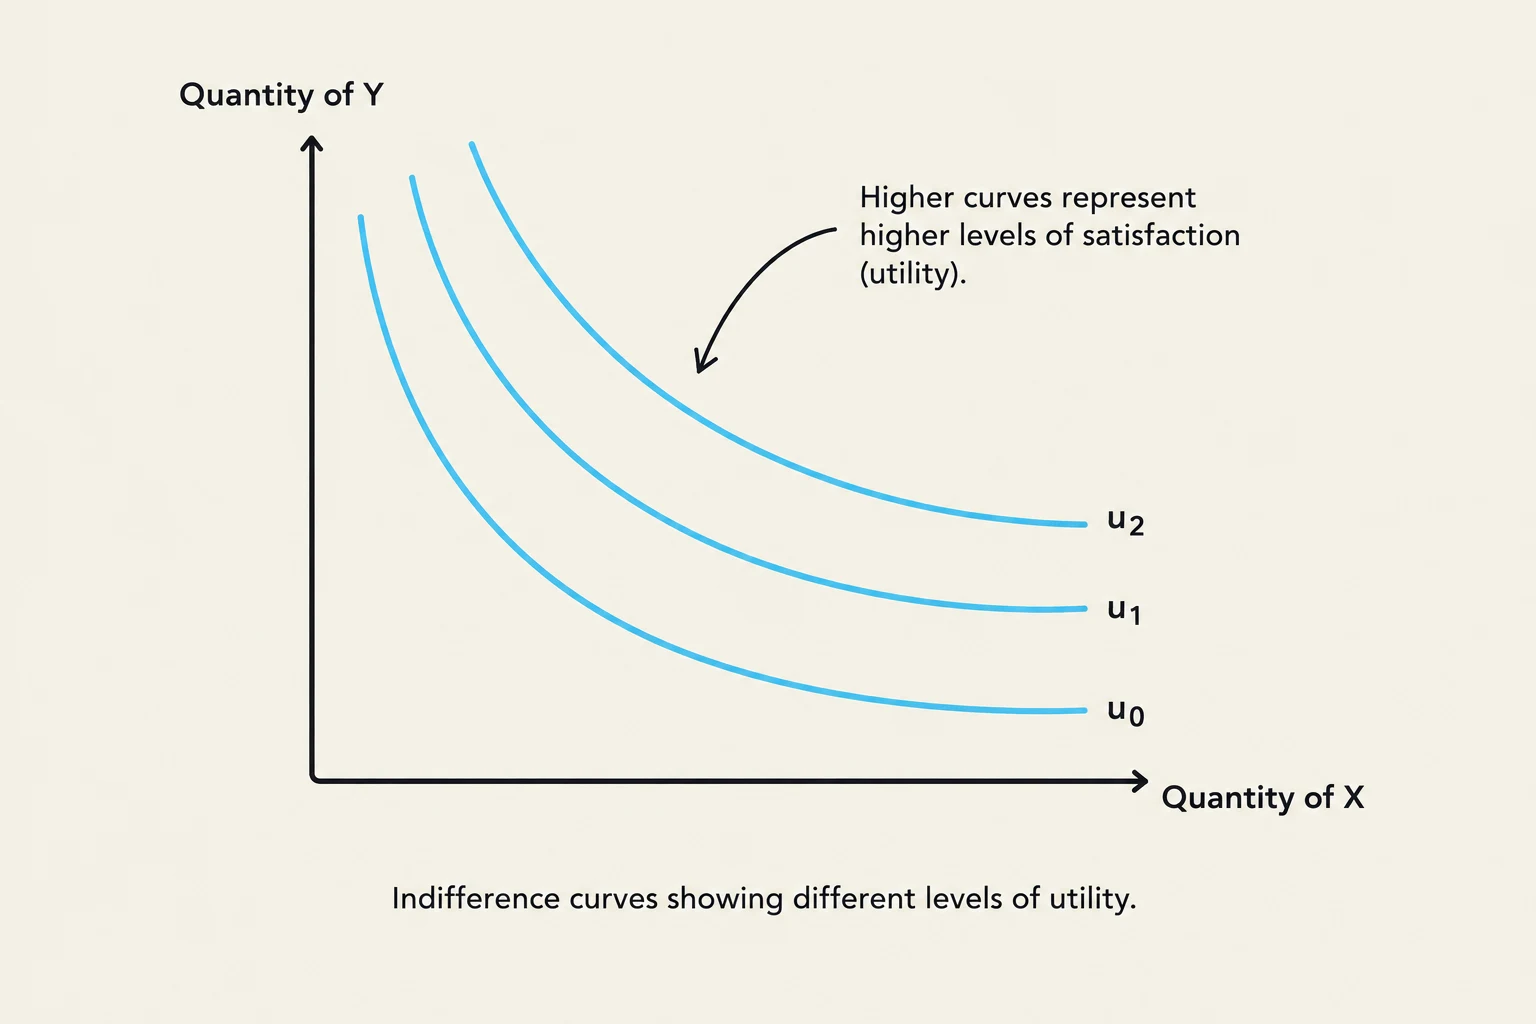
A utility curve maps out different combinations of two goods—typically labeled as the quantity of and the quantity of —that provide the consumer with the exact same level of total satisfaction (utility).
Visualizing Utility
When we graph these curves on a coordinate plane, the vertical axis represents the quantity of and the horizontal axis represents the quantity of .
Key characteristics of these curves include:
- Convexity: Most utility curves are downward-sloping and convex to the origin. This reflects the "diminishing marginal rate of substitution"—as you get more of good , you are willing to give up less and less of good to get even more .
- Utility Levels: Higher curves represent higher levels of utility. In a standard graph, an innermost curve might be labeled , a middle curve , and an outermost curve . Because the outermost curve is further from the origin, it represents a combination of goods that provides more total satisfaction than the curves inside it.
Keep reading for free.
Create an account to finish this reading and make it part of your study routine.
Continue reading freeAlready have an account? Log in
Updated