This content explains various methods for determining DNA concentration and purity, including UV absorbance spectrophotometry, fluorescence-based detection, and electrophoresis. It details the principles, equipment, calculations, and purity assessment ratios (A260/A280 and A260/A230).
In molecular biology, knowing the exact concentration and purity of your DNA is a fundamental step for successful downstream applications like PCR, cloning, or sequencing. Depending on the concentration of your sample, the required precision, and the presence of contaminants, researchers choose from several distinct methodologies: absorbance-based spectrophotometry, fluorescence-based detection, or electrophoretic separation.
UV Absorbance (OD @ 260 nm)
The most common method for rapid DNA quantification is measuring the absorbance of light at a wavelength of 260 nm using a spectrophotometer. This method relies on the fact that the nitrogenous bases in DNA absorb ultraviolet light.
Equipment and Calculation
To perform this measurement, you typically use a spectrophotometer equipped with a UV lamp. Because standard plastic cuvettes absorb UV light, you must use UV-transparent quartz cuvettes. Modern laboratories often use microvolume instruments (such as NanoDrop or NanoVue), which allow for measurements using only 0.5–2 μL of sample without the need for a cuvette.
To calculate the concentration from the absorbance reading, the following formula is used:
If you need to find the total DNA yield (the total mass of DNA in your tube), you use the concentration multiplied by the total sample volume:
DNA yield (μg)=DNA concentration×total sample volume (mL)
Note on Standards: The constant 50μg/mL is a standard reference for double-stranded DNA (dsDNA). However, different nucleic acids have different profiles. For example, single-stranded DNA (ssDNA) has an A260 value of 37μg/mL, while ssRNA is 40μg/mL.
Determining Oligonucleotide Concentration
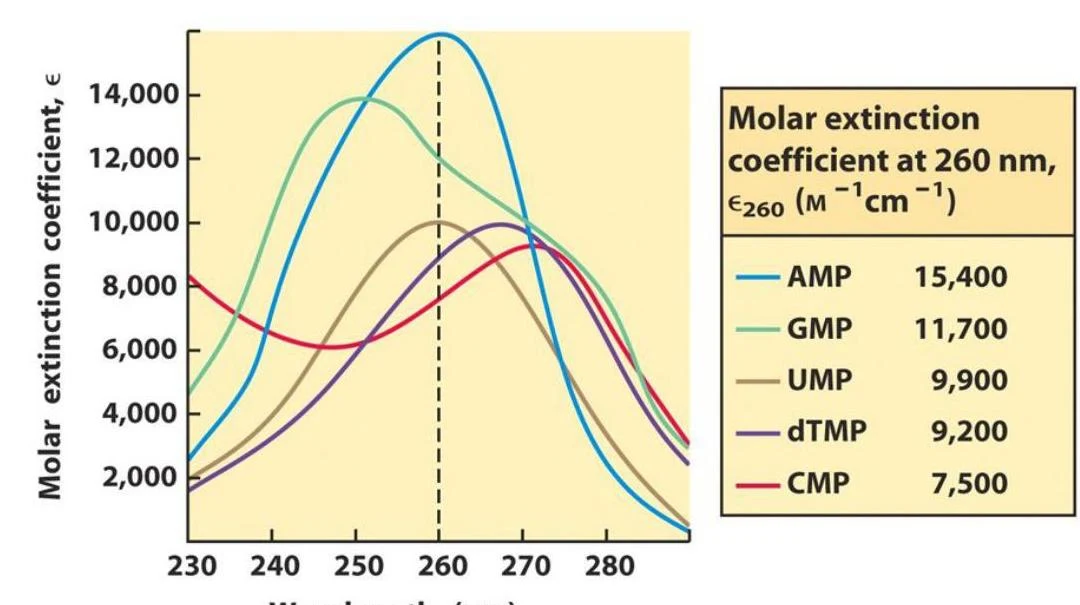
When working with short sequences like PCR primers, the "average" absorbance value might not be accurate because the specific sequence of nucleotides significantly affects the molar extinction coefficient. In these cases, the concentration should be calculated based on the exact sequence of the oligonucleotide.
This graph illustrates the molar extinction coefficients of different nucleotides (AMP, GMP, UMP, dTMP, and CMP) as a function of wavelength, with a table showing their specific molar extinction coefficients at 260 nm.
Assessing DNA Purity
Absorbance is not just for concentration; it is also a powerful tool for assessing the purity of your sample by looking at absorbance ratios:
A260/A280 Ratio: This measures protein contamination. A pure DNA sample should have a ratio between 1.8 and 2.0.
A260/A230 Ratio: This measures organic contamination (such as phenol or carbohydrates). A pure sample should be between 2.0 and 2.2. A ratio lower than 1.5 indicates significant organic contamination.
Fluorescence-Based Methods
Fluorescence is generally more sensitive than absorbance, making it the preferred choice for low-concentration samples.
This method utilizes fluorescent DNA-binding dyes that specifically interact with DNA molecules. When these dyes bind to the DNA, they emit light at a specific wavelength when excited. To quantify the DNA, you must use a fluorometer and establish a standard curve. This involves measuring a series of "standards"—samples of known DNA concentration of the same type (e.g., genomic DNA or plasmid DNA)—to create a mathematical relationship between fluorescence intensity and concentration.
Electrophoresis
Electrophoresis separates DNA molecules based on their size and allows for both qualitative and quantitative analysis.
Agarose Gel Electrophoresis
In this method, DNA is loaded into an agarose matrix and subjected to an electric field. Because DNA is negatively charged, it migrates toward the positive electrode. To visualize the DNA, an intercalating DNA dye is added to the gel.
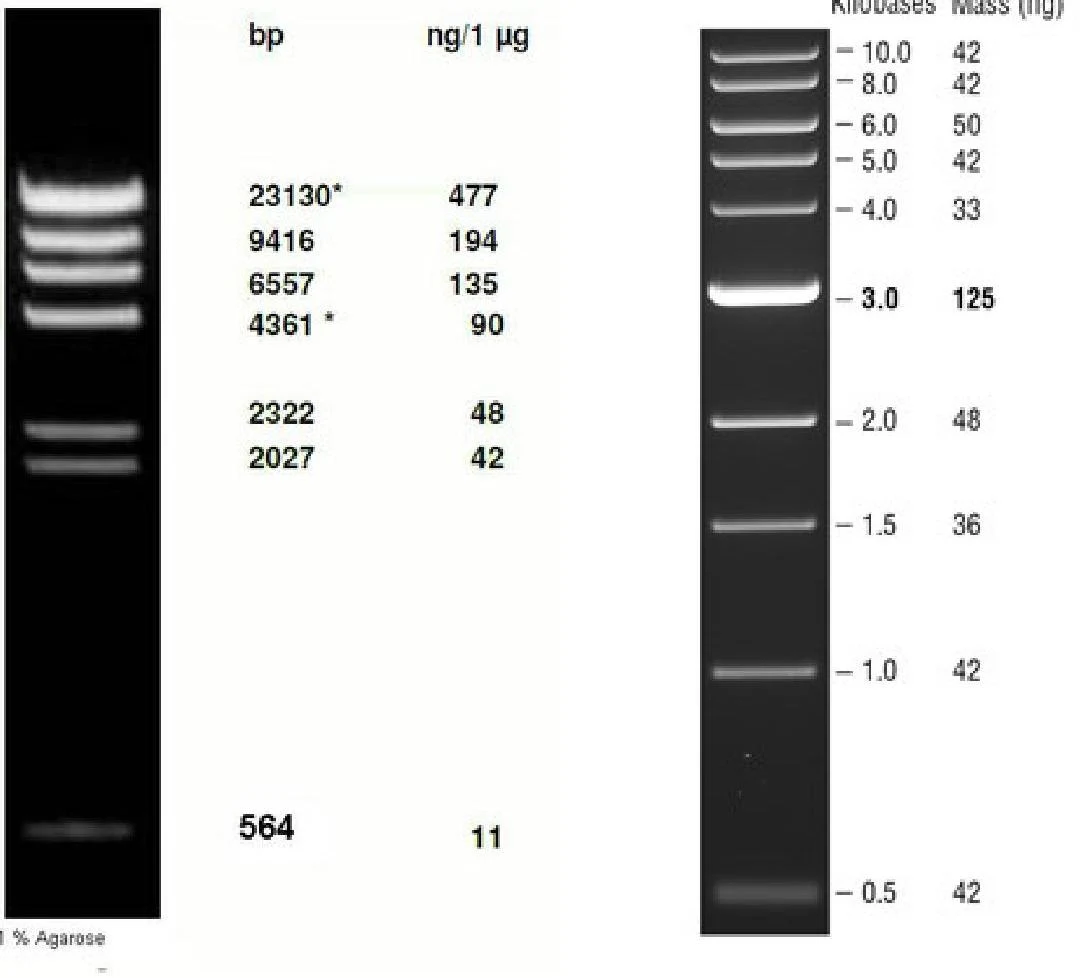
To quantify the DNA, you run an "appropriately sized DNA standard" (a DNA ladder) alongside your samples. By comparing the brightness of your sample band to the known mass of the bands in the ladder, you can estimate the concentration. This method also allows you to see if contaminants are present, as they will separate into different bands from the DNA of interest.
This image displays two DNA ladders, which are used as molecular weight markers in gel electrophoresis. The left ladder shows fragment sizes in base pairs (bp) and corresponding masses in nanograms per microgram (ng/µg). The right ladder shows fragment sizes in kilobases (kb) and corresponding masses in nanograms (ng).
Capillary Electrophoresis
Beyond traditional agarose gels, capillary electrophoresis is another advanced method used to determine DNA concentration and fragment size with high resolution.
Summary of Alternative Methods
Other specialized methods include:
Diphenylamine method: An older colorimetric method that measures absorbance at 595 nm.
Microvolume Spectrophotometry: Using instruments like NanoDrop for rapid, small-volume assessment.
Exam Tip: If a question asks which method is best for a very dilute sample, choose Fluorescence. If it asks for the quickest way to check purity, look for the A260/A280 ratio via spectrophotometry.
Keep reading for free.
Create an account to finish this reading and make it part of your study routine.