Measuring Population Health: Indicators and Epidemiology
This content explains health indicators, their criteria for usefulness, and epidemiological concepts like incidence and prevalence. It also covers measuring health status, mortality, and the distinction between health inequality and inequity, with a brief look at the Canadian health system context.
How do we know if a population is healthy? Is it simply a matter of how many people are alive, or does it involve something deeper? To answer these questions, public health professionals use health indicators—quantitative and qualitative tools designed to describe, monitor, and evaluate the health status of a population and the performance of health systems. These indicators are essential for informing public health decisions, allocating resources, and ensuring accountability for public funds.
The Anatomy of a Useful Indicator
Not all measurements are created equal. For an indicator to be useful in a public health context, it must meet several rigorous criteria:
Validity: It must actually measure what it is intended to measure.
Reliability: It must produce consistent results over time.
Sensitivity: It must be able to detect meaningful changes or trends.
Feasibility: It must be realistically and cost-effectively measurable.
Relevance and Actionability: It must address important issues and provide data that can actually inform decision-making.
In practice, indicators serve different roles. They can measure a process/output (e.g., the percentage of food premises inspected), a population outcome (e.g., the incidence of foodborne illness), or equity (e.g., comparing illness rates between different geographic or socioeconomic areas).
Exam Tip: If a question asks you to distinguish between an "output" and an "outcome," remember that the output is what you did (e.g., number of vaccinations administered), while the outcome is what changed as a result (e.g., a decrease in disease incidence).
Epidemiology: Incidence vs. Prevalence
When analyzing disease data, a critical distinction must be made between how many people get a disease and how many people have it. Using raw counts can be misleading; instead, we use rates to account for the population size.
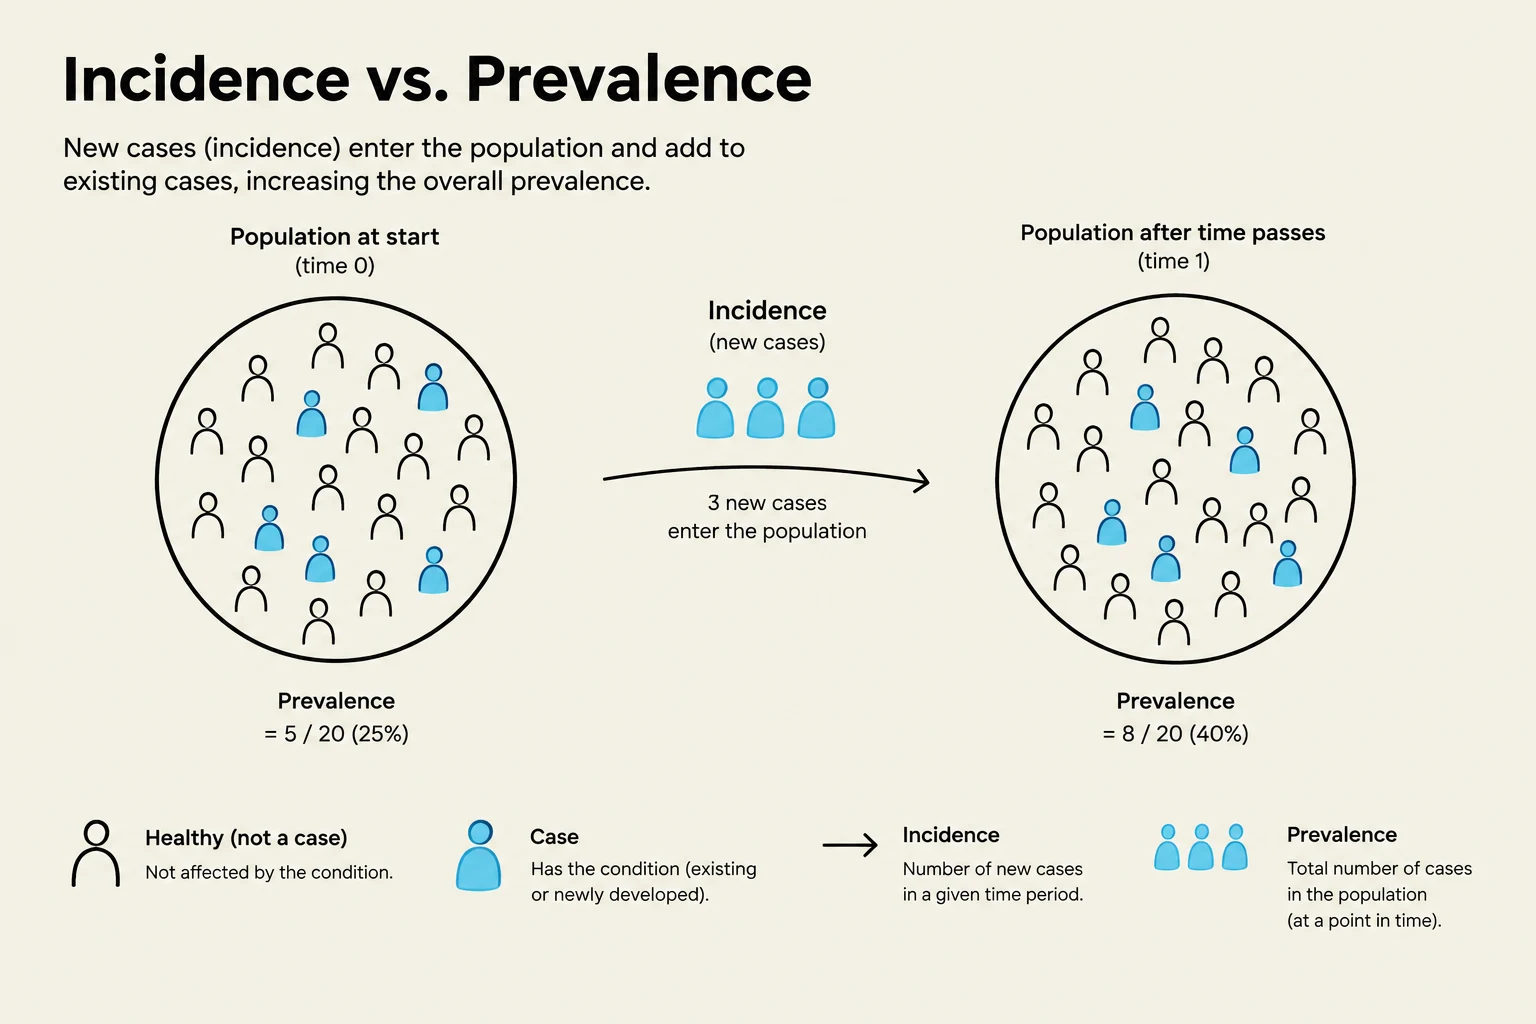
Incidence refers to the number of new events occurring in a population over a specific period. It is a key measure for assessing the effectiveness of prevention programs. For example, if a new vaccine is introduced, we expect the incidence of that disease to drop.
Prevalence measures the total proportion of a population living with a condition at a specific point in time (point prevalence) or during a defined period (period prevalence). Prevalence is vital for determining the capacity needed for ongoing services, such as how many dialysis machines or diabetes clinics a city requires.
Prevalence=Total population at that timeTotal number of existing cases
This diagram illustrates the difference between incidence and prevalence in a population. Incidence refers to new cases, while prevalence is the total number of cases at a specific time. The example shows how new cases increase the overall prevalence over time.
It is possible for incidence to fall while prevalence rises. This often happens when medical advancements allow people to live longer with a chronic condition; they are no longer "new" cases, but they remain in the "existing" pool.
Measuring Health Status and Mortality
Health is multidimensional. It encompasses disease and injury, mortality and survival, function and disability, and even perceived health—how individuals subjectively rate their own wellbeing. While clinical measures like lab results are objective, self-rated health can capture environmental factors or lifestyle risks that a doctor might miss.
To compare different populations fairly, we cannot rely on crude mortality rates (total deaths in a population) because they are heavily influenced by demographics and age structure. For example, an older population will naturally have a higher crude mortality rate than a younger one, even if the older population is actually "healthier" in terms of access to care. To fix this, we use age-standardized mortality rates, which adjust the data to account for these structural differences.
Common mortality indicators include:
Infant mortality rate: Deaths before age 1 per 1,000 live births.
Life expectancy: The average years a person is expected to live under current conditions.
Cause-specific mortality: Deaths attributed to specific conditions like cancer, circulatory disease, or diabetes.
This graphic illustrates three mortality indicators: crude mortality rate, age-specific mortality rate, and age-standardized mortality rate, explaining how each provides a different perspective on population health.
Health Inequality vs. Health Inequity
In public health, we must distinguish between differences that are biological and those that are systemic.
Health Inequality: Refers to inherent or biological differences between groups, such as the natural decline in health that occurs with aging.
Health Inequity: Refers to the unfair, socially constructed distribution of social and economic conditions required for good health. These are systemic barriers—such as lack of access to clean water or nutritious food—that prevent equal opportunity for health.
Understanding inequity requires a lens of intersectionality (how overlapping systems of oppression, like racism and sexism, create unique disadvantages) and heterogeneity (recognizing that members of a single group experience discrimination differently).
Language Matters: Effective practice requires moving away from disempowering terms. Instead of "vulnerable populations," which can underplay the causes of disadvantage, use equity-seeking groups to imply agency, or priority populations for targeted interventions. Always use person-first language (e.g., "people who inject drugs" rather than "injection drug users").
The Canadian Context: Spending and Outcomes
Canada operates under a National Health Insurance model, where the government is the sole payer for essential services, but delivery is often private or semi-private. This system is governed by the Canada Health Act, which mandates principles of public administration, comprehensiveness, universality, portability, and accessibility.
When evaluating the Canadian system, we often look at health spending as a percentage of Gross Domestic Product (GDP). Canada’s expenditure (approximately $11.2%$) is higher than the OECD average of $9.1%$, though significantly lower than the United States ($16.7%$).
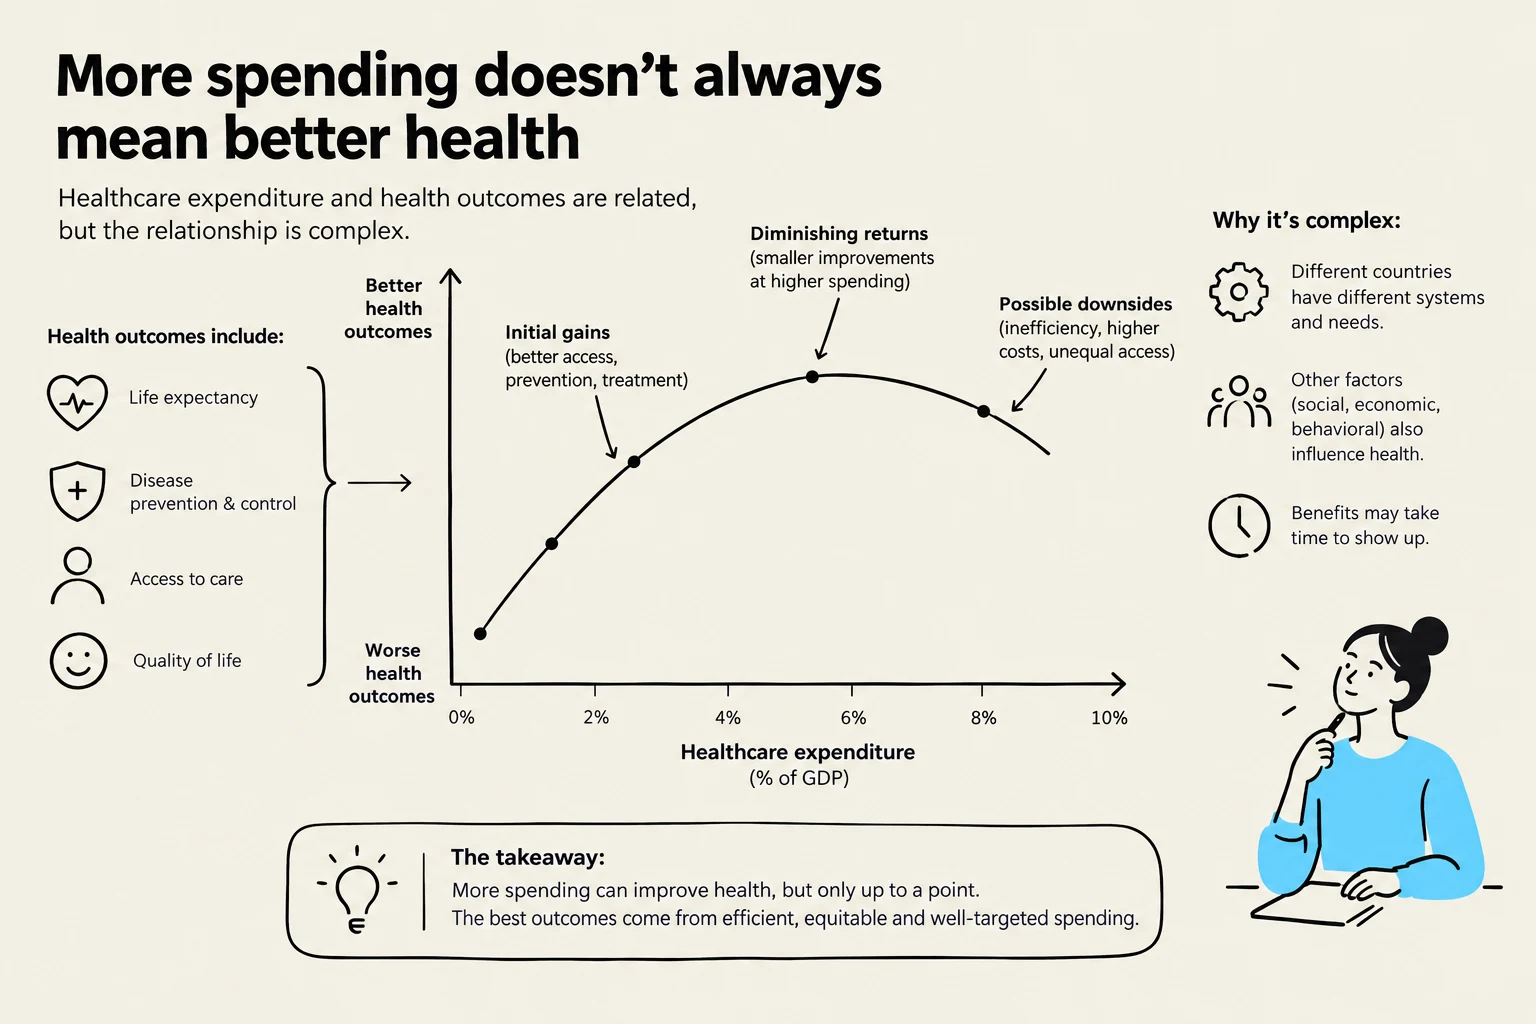
However, increased spending does not automatically guarantee superior outcomes. To truly assess performance, analysts look at a combination of indicators, including:
Life expectancy and infant mortality.
Premature mortality.
Mortality from specific causes (e.g., cancer, respiratory disease, mental disorders).
Mortality due to medical misadventures.
The relationship between healthcare expenditure and health outcomes is complex, with diminishing returns and potential downsides beyond a certain point of spending.
Ultimately, the relationship between money and health is complex. High spending is a necessary input, but the true measure of a health system lies in how effectively those resources are translated into equitable, high-quality outcomes for all members of the population.
Keep reading for free.
Create an account to finish this reading and make it part of your study routine.